|
5.3 The Nyquist Plot
The Nyquist plot allows us to gain insight into the stability of the closed-loop system by analyzing the contour of the frequency response function on the complex plane.


Creating the Nyquist plots.
If no frequency range is specified, NyquistPlot will try to plot the graph for both negative and positive frequencies (a task that can be avoided by plotting only half of the curve and then reflecting it over the real axis).
Note that jumps may appear in the Nyquist plot when the frequency response changes rapidly. That may be corrected by choosing a higher value for the PlotPoints option.
Consider an open-loop transfer function.
In[22]:=
Out[22]=
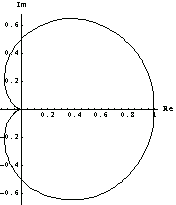
This is the corresponding Nyquist plot. The contour does not encircle the  point and the transfer function does not have unstable poles; therefore, the closed-loop system will be stable. point and the transfer function does not have unstable poles; therefore, the closed-loop system will be stable.
In[23]:=

Like the other frequency response plotting functions, NyquistPlot is capable of handling nonpolynomial transfer functions. Note, however, that such systems must be supplied in transfer function form and the desired frequency range must be specified, since conversion from the state space works for linear systems only and so does the routine which determines the default frequency range.
Here is a system consisting of a transport lag  and first-order lag and first-order lag  , for the unit values of , for the unit values of  and and  . .
In[24]:=
Out[24]=
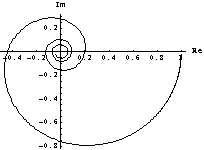
This is the Nyquist plot for this system.
In[25]:=

Like BodePlot, NyquistPlot accepts the PlotPoints and PlotSampling options, as well as options pertinent to ListPlot.
|

