|
5.2.2 Gain and Phase Margins
Important insight into the stability of the closed-loop system can be achieved by analyzing the gain and phase margins of the system before closing the loop. The margins can be computed using GainPhaseMargins and displayed on the Bode plot using the option Margins, which accepts either the result of GainPhaseMargins (if it was computed prior to the call to BodePlot) or True to compute the margins transparently. The MarginStyle option can be used to specify the graphics primitive for margins in a manner similar to the PlotStyle option. If Margins is set to False, the margins are not computed (the default).


Gain and phase margins.
As an exercise, let us select gain  for the system shown in Figure 5.2 such that the phase margin is greater than for the system shown in Figure 5.2 such that the phase margin is greater than  and the gain margin is greater than and the gain margin is greater than  dB (Brogan (1991)). dB (Brogan (1991)).

Figure 5.2. Example system for gain and phase margin selection.
This defines the plant.
In[17]:=
Out[17]=
This is the regulator.
In[18]:=
Out[18]=
Here is the open-loop system formed from the above blocks.
In[19]:=
Out[19]=
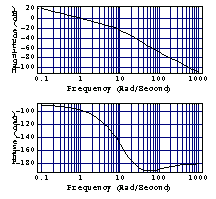
This is the Bode plot for a particular value of k.
In[20]:=

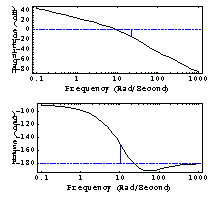
We observe that at  the phase is around the phase is around  , which would give the desired phase margin of , which would give the desired phase margin of  if we increase the gain by if we increase the gain by  dB, the value by which the current gain at this frequency is less than zero. That would lead to a gain margin somewhat more than dB, the value by which the current gain at this frequency is less than zero. That would lead to a gain margin somewhat more than  dB at dB at  , the current crossover frequency, which would satisfy the specification. , the current crossover frequency, which would satisfy the specification.
This is the Bode plot for the increased gain, with the gain and phase margins displayed. We can see that the specifications are met.
In[21]:=

Gain and phase margins are determined by finding the crossover points of the frequency response, which can be done either analytically or from the interpolation of the response curve computed on a frequency grid. The method can be selected using the option Method, which accepts values Analytic or Interpolation. The freedom of choosing the method is restricted to continuous-time systems; for discrete-time systems, the margins are always computed via interpolation.

Options specific to GainPhaseMargins.
When margins are to be plotted, the Automatic value for PhaseRange corresponds to the phase range of {-360, 0} degrees. Using the option PhaseRange, you may set the phase range differently.
|