|
2.4 Fuzzy Modeling
2.4.1 Introduction
The goal of this notebook is to demonstrate how Fuzzy Logic can be used for modeling. We plan to show how fuzzy sets can be used to represent a real system or process. In this demonstration, we use modeling data from a paper in which the authors investigate the effects of using various fuzzy operators for constructing models [Stachowicz and Kochanska, 1987]. We only look at one example from the paper, but it may be instructive to try to duplicate some of the other models with different operators.
To demonstrate fuzzy modeling, we use many functions from Fuzzy Logic, along with standard Mathematica functions. Fuzzy Logic contains numerous functions for working with fuzzy sets and fuzzy logic; this notebook demonstrates only a few of those functions. For specific information on the functions used in this notebook, refer to the Introduction and Manual.
This loads the package.
In[1]:=
2.4.2 Representing the Model Input
The Process
In this notebook, we will be modeling a theoretical relationship between a set of input and a set of output. We scaled the input and output numbers used in the original paper by 100, so if their output was 400, ours will be 4.
We start with a list of the input-output pairs for the process. The first number in each pair represents the input to the system, and the second item is the system output. It is this input-output relationship that we intend to model. In this example, we start with a list of specific points, but for fuzzy modeling, exact points are not required. Instead of the first input being exactly {1, 20}, it could be thought of in the following way: if the input is approximately one then the output is around twenty.
In[2]:=
Dividing the Input Range
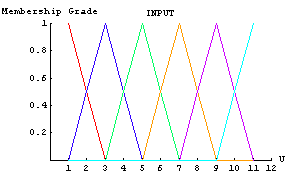
One of the first things to consider when designing a model is the range for the input variables. From the original data, we see that the input ranges from 1 to 11; we use this range as the universal space for our input variable. Once we have a reasonable range, we can consider how to divide that range into descriptive linguistic terms. For this model, we are using 6 membership functions to divide up the input universal space. We will repeat that using the CreateFuzzySets function. The following command divides the universal space into six even triangular fuzzy sets. Notice how we assign linguistically significant names to the six membership functions.
In[3]:=
Viewing the Membership Functions
We can take a look at our membership functions with the FuzzyPlot command. Notice in this example how we use one of Mathematica's standard plotting options, PlotLabel, with our fuzzy plotting function. Remember, all of Mathematica's standard plotting options can be used with the FuzzyPlot function, so you can customize the look of your plots.
In[4]:=
2.4.3 Representing the Model Output
Dividing the Output Range
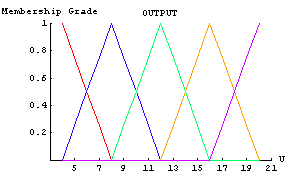
Like the input, the range of the output variable must be divided up into various membership functions. Looking at our original data, we see that the output ranges from 4 to 20 over the input range; we use this as our universal space. For this example, the authors of the original paper chose to use five fuzzy sets to represent the output. We will do the same thing by again using the CreateFuzzySets function. Notice how we give the five fuzzy sets linguistically significant names from NZero to NSuperbig. It is important when naming membership functions to use distinct names.
In[5]:=
Viewing the Membership Functions
We plot the output membership functions using the FuzzyPlot function.
In[6]:=
2.4.4 Creating Linguistic Control Rules
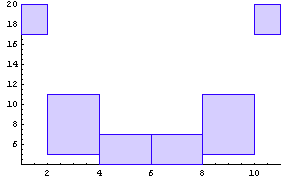
With our inputs and outputs defined, we need only specify a set of rules to create a model. In this package, rules are organized as a list of ordered pairs. The first item in the pair represents the input condition or the if part of the implication. The second item in the pair represents the output condition or the then part of the implication. For example, looking at the list of rules that follow, we see that the first pair in the list is {Inull, NSuperbig}. This rule would be equivalent to the verbal statement:
If the input is Inull then the output is NSuperbig.
You see that this type of modeling is intuitively easy. The specified rules may be based on test data or simply on observations. By examining our original data, we can see the basis for the first rule. The first data point is {1, 20}, which corresponds to a very small input (Inull) and a very large output (NSuperbig). Here is the complete list of rules that were used in the paper [Stachowicz and Kochanska, 1987]. Note that there is a rule associated with each of the input membership functions.
In[7]:=
Viewing the Linguistic Rules
We plot the linguistic rules using the FuzzyGraph function.
In[8]:=
2.4.5 Building the Model
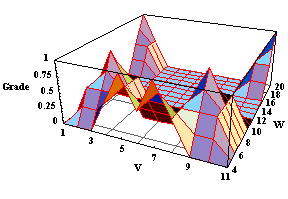
With all the necessary ingredients defined, we can create our model. To do that, we call BuildModel with our list of rules. The BuildModel function creates a fuzzy relation from each of the rules we specified using the SetsToRelation function. It then combines all of the fuzzy relations using the Union operator. It is possible to use other operators to combine the rules, and that is the subject of the paper we are following [Stachowicz and Kochanska, 1987]. The end result of the BuildModel function is a single fuzzy relation, which should give a good representation of the process we are modeling.
Creating the Model Fuzzy Relation
This statement creates a fuzzy relation that will model our process.
In[9]:=
Displaying the Model Fuzzy Relation
We look at the fuzzy relation that will serve as the model for our process using the FuzzySurfacePlot function.
In[10]:=
2.4.6 Using the Model
Inferencing
To use our model to evaluate inputs, we use the CompositionBasedInference function. It takes as arguments a fuzzy set, which represents the input, and a fuzzy relation, which is our model. It performs a MaxMin type Composition with them to come up with fuzzy output. In this example, we use a MeanOfMax defuzzification to get a crisp value.
We use a singleton fuzzy set as input to the inferencing function. Here we set up a function that calls the inferencing function with the proper input. We need only provide this function an integer in the range 1 to 11, and MyModeler will provide the crisp output of the model.
In[11]:=
Model Results
Table of Results
To see what kind of results the model provides, we make a table of input-output pairs for the entire range of inputs. We accomplish this with Mathematica's Table function, and we will look at the results in TableForm.
In[12]:=
In[13]:=
Out[13]//TableForm=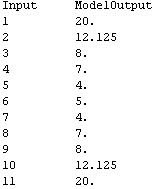
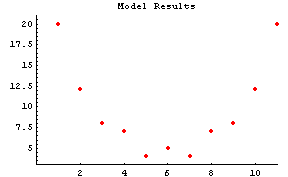
Graph of Results
We plot these results to see how well our model performs. We do this with the ListPlot function.
In[14]:=
2.4.7 Evaluating the Model
To see how well our model performed, we compare the original data with the results from our model. We can compare the results in table form and with a graph.
Table Comparison
Here we create a table showing input, original output, model output, and absolute error.
In[15]:=
In[16]:=
Out[16]//TableForm=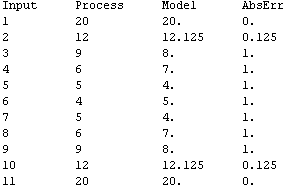
Graphical Comparison
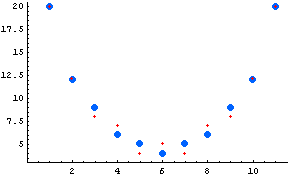
We again use ListPlot to show the results. This function will plot the original process data as large blue dots and our model data as smaller red dots. You can see that the model performs quite well for its simple design. It is possible to create entirely different models by changing operators, defuzzification strategies, rules, or membership functions. Feel free to create a different model and compare your results to this one.
In[17]:=
References
M. S. Stachowicz and M. E. Kochanska, Analysis of the application of fuzzy relations in modeling, Proc. North American Fuzzy Information Society '86, New Orleans, 1986.
M. S. Stachowicz and M. E. Kochanska, Fuzzy modeling of the process, Proc. of Second International Fuzzy Systems Association Congress, Tokyo, 1987.
L. A. Zadeh, The concept of a linguistic variable and its applications to approximate reasoning-I, Information Sciences, vol. 8, pp. 199-249, 1975.
L. A. Zadeh, The concept of a linguistic variable and its applications to approximate reasoning-II, Information Sciences, vol. 8, pp. 301-357, 1975.
L. A. Zadeh, The concept of a linguistic variable and its applications to approximate reasoning-III, Information Sciences, vol. 9, pp. 43-80, 1975.
|