|
2.8 Additional Examples
2.8.1 Introduction
This notebook contains a number of simple problems, which can be dealt with using fuzzy sets. We provide a solution for each problem, but encourage you to try to come up with your own solutions to some of the problems.
If Fuzzy Logic isn't already loaded, it should be loaded before beginning the problems in this notebook. This loads the package.
In[1]:=
2.8.2 Example 1: Classifying Houses
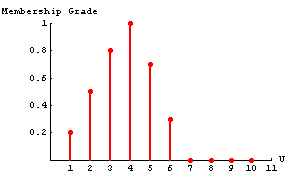
Problem. A realtor wants to classify the houses he offers to his clients. One indicator of comfort of these houses is the number of bedrooms in them. Let the available types of houses be represented by the following set.
U = {1, 2, 3, 4, 5, 6, 7, 8, 9, 10}
The houses in this set are described by u number of bedrooms in a house. The realtor wants to describe a "comfortable house for a 4-person family," using a fuzzy set.
Solution. The fuzzy set "comfortable type of house for a 4-person family" may be described using a fuzzy set in the following manner.
In[2]:=
In[3]:=
2.8.3 Example 2: Representing Age
Problem 2-1. Fuzzy sets can be used to represent fuzzy concepts. Let U be a reasonable age interval of human beings.
U = {0, 1, 2, 3, ... , 100}
Solution 2-1. This interval can be interpreted with fuzzy sets by setting the universal space for age to range from 0 to 100.
In[4]:=
Problem 2-2. Assume that the concept of "young" is represented by a fuzzy set Young, whose membership function is given by the following fuzzy set.
In[5]:=
The concept of "old" can also be represented by a fuzzy set, Old, whose membership function could be defined in the following way.
In[6]:=
We define the concept of middle-aged to be neither young nor old. We do this by using fuzzy operators from Fuzzy Logic.
Solution 2-2. We can find a fuzzy set to represent the concept of middle-aged by taking the intersection of the complements of our Young and Old fuzzy sets.
In[7]:=
We can now see a graphical interpretation of our age descriptors by using the FuzzyPlot command.
In[8]:=
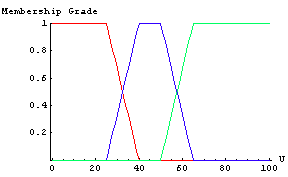
From the graph, you can see that the intersection of "not young" and "not old" gives a reasonable definition for the concept of "middle-aged."
2.8.4 Example 3: Finding the Disjunctive Sum
Problem. Find the disjunctive sum of the two fuzzy relations defined here.
In[9]:=
In[10]:=
In[11]:=
In[12]:=
In[13]:=
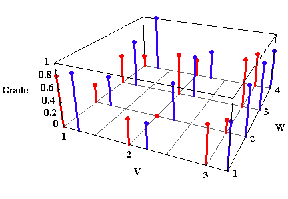
The disjunctive sum of fuzzy relations R and S in the universal space VxW can be found with the following formula.
DisSum = (R  S') S')  (R' (R'  S) S)
The disjunctive sum is thus a relation in VxW that has the following property:
For all (v, w) in VxW, DisSum(v, w) =
Max(Min(R(v, w), 1 - S(v, w)), Min(1 - R(v, w), S(v, w)))
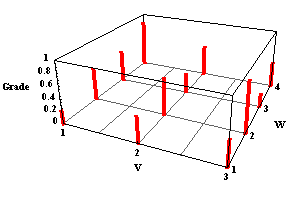
Solution. We can find disjunctive sum of the two fuzzy relations R and S by using the formula derived earlier and some of the functions from Fuzzy Logic.
In[14]:=
In[15]:=
In[16]:=
Out[16]//MatrixForm=
2.8.5 Example 4: Natural Numbers
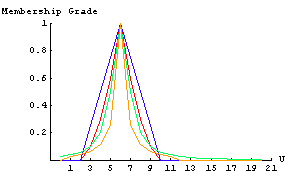
Problem. Suppose you are asked to define the set of natural numbers close to 6. There are a number of different ways in which you could accomplish this using fuzzy sets.
Solution 1. One solution would be to manually create a fuzzy set describing the numbers near 6. This can be done as follows:
In[17]:=
In[18]:=
In[19]:=
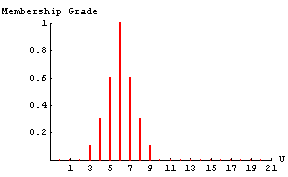
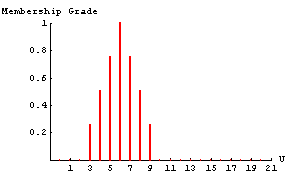
Solution 2. A second solution would be to use the FuzzyTrapezoid function to create the fuzzy set. For a case such as this, a triangular fuzzy set would probably be better than a trapezoid, so we set the middle two parameters of the FuzzyTrapezoid function to 6.
In[20]:=
In[21]:=
Solution 3. Another solution would be to use a function to create a fuzzy set representing numbers near 6.
In[22]:=
We can use this function to create a fuzzy set for numbers near 6.
In[23]:=
In[24]:=
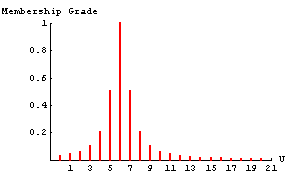
Note that this is a convenient method because the function CloseTo can be called with any integer argument to produce a fuzzy set close to that number.
Solution 4. Still another solution is to use a piecewise function to describe the fuzzy set.
In[25]:=
In[26]:=
In[27]:=
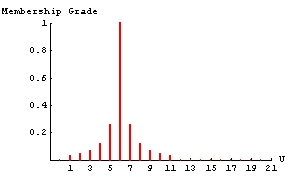
Now, we can view all four of our fuzzy representations of the number six to see how they compare. We do this by plotting them all on the same graph with the FuzzyPlot function.
In[28]:=
2.8.6 Example 5: Fuzzy Hedges
Problem. Suppose you had already defined a fuzzy set to describe a hot temperature.
In[29]:=
In[30]:=
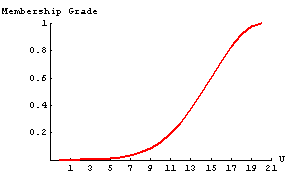
Now, suppose we want to talk about the degree to which something is hot. We need some sort of fuzzy modifier or a hedge to change our fuzzy set. Look at how we can accomplish this.
Solution. We can start by defining how a fuzzy set should be modified to represent the hedges "Very" and "Fairly." Two functions in Fuzzy Logic, Concentrate and Dilate, can be used to define our two hedges.
In[31]:=
Now we can look at a graph of the fuzzy sets FairlyHot, Hot, and VeryHot.
In[33]:=
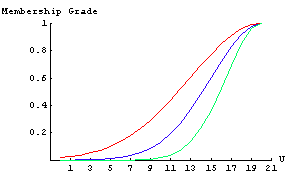
Note that the FairlyHot membership function is a more general, spread-out fuzzy set. The VeryHot fuzzy set is a more focused, concentrated fuzzy set.
We can also apply more than one modifier to a fuzzy set. For instance, let us compare Hot, VeryHot, and VeryVeryHot.
In[34]:=
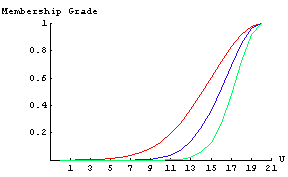
As we might expect, the VeryVeryHot fuzzy set is even more concentrated than the VeryHot fuzzy set.
2.8.7 Example 6: Distance Relation
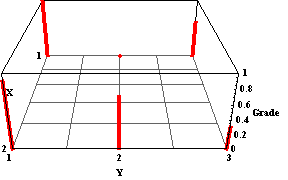
Problem. Let R be a fuzzy relation between the sets, X = {NYC, Paris} and Y = {Beijing, NYC, London}, that represents the idea of "very far." In list notation, the relation could be represented as follows [Klir & Folger, 1988].
R(X,Y) = 1.0/NYC, Beijing + 0/NYC, NYC + 0.6/NYC, London
+ 0.9/Paris, Beijing + 0.7/Paris, NYC + 0.3/Paris, London
Solution. We can represent this fuzzy relation in Mathematica in the following way. We can start by creating the membership matrix to represent the relation.
In[35]:=
Out[35]=
We need to represent the cities in each set with numbers. For set X, let NYC be 1, and Paris be 2; for set Y, let Beijing be 1, NYC be 2, and London be 3. Now we can create the relation using the FromMembershipMatrix function.
In[36]:=
Out[36]=
We can plot this relation using the FuzzyPlot3D function. We will use some of Mathematica's Plot3D options to put the graph in a form that lines up with the membership matrix so that you can see the correlation.
In[37]:=
In[38]:=
Out[38]//MatrixForm=
By customizing the graph, you can get it to match the membership matrix, which makes understanding the fuzzy relation easier.
2.8.8 Example 7: Choosing a Job
Problem. Fuzzy sets can be used to aid in decision making or management. We illustrate this with an example from Klir and Folger [Klir and Folger, 1988]. Given four jobs (Jobs 1, 2, 3, and 4), our task is to choose the job that will give us the highest salary, given the constraints that the job should be interesting and close to our home.
Solution. The first constraint of job interest can be represented with the following fuzzy set.
In[39]:=
Out[39]=
We can see that Job 3 has the highest membership grade, meaning that Job 3 is the most interesting of the four jobs. Job 1 on the other hand is the least interesting, since it has a membership grade of only 0.4.
We can form a fuzzy set for our second constraint in a similar manner. Here is a fuzzy set used to represent the driving distance to the four jobs.
In[40]:=
Out[40]=
In the fuzzy set above, the membership grades indicate the length of the drive to work. A high membership grade indicates that it is a short drive to work—a good thing. A small membership grade indicates an undesirable, long drive to work. From the fuzzy set above, we can see that Job 4 is located near our home, while Job 1 is a long way from our home.
Finally, we need to figure in the goal of a good salary. There is no real difference between a constraint and a goal in this problem, so we figure in the worth of the salary the same way we did for the previous constraints. We could use a formula to convert a salary into a membership grade for each job [Klir & Folger, 1988], but to stay with the tradition of our previous constraints, we arbitrarily assign a membership grade to each job based on salary.
In[41]:=
Out[41]=
From this fuzzy set, we see that Job 1 pays the highest salary, and Job 4 pays the lowest. Now that all of our criteria is represented as fuzzy sets, we need to decide on a function to make the decision. We will use the standard Intersection to make the fuzzy decision. Applying the Intersection operation can be thought of as adding the constraints and goals to come up with the best overall decision.
In[42]:=
Out[42]=
We can plot the decision fuzzy set to see the results graphically.
In[43]:=
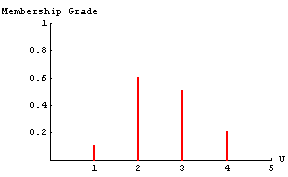
At last, we can look for the maximum membership grade to decide which job best satisfies our goals and constraints. In this example, we see that Job 2 appears to be the best job for us.
There are a number of different ways that the decision in this example could have been made. For example, we could have used a different operator, maybe a product operator, to make our decision; we could have weighted different constraints more heavily than others; or we could have used different functions to arrive at the membership grades. As an exercise, try using a different method and see which job your method selects as the best.
2.8.9 Example 8: Digital Fuzzy Sets
Problem. Suppose you are asked to compare fuzzy sets to digital fuzzy sets.
Solution. Below is an example of a set with 6 digital membership functions defined over the range from 0 to 20.
In[44]:=
In[46]:=
In[47]:=
 ukasiewicz sets can be viewed and manipulated in the same manner as infinite valued fuzzy sets. For a graphic representation of the above set, execute the following fuzzy plot command. ukasiewicz sets can be viewed and manipulated in the same manner as infinite valued fuzzy sets. For a graphic representation of the above set, execute the following fuzzy plot command.
In[52]:=
In[53]:=
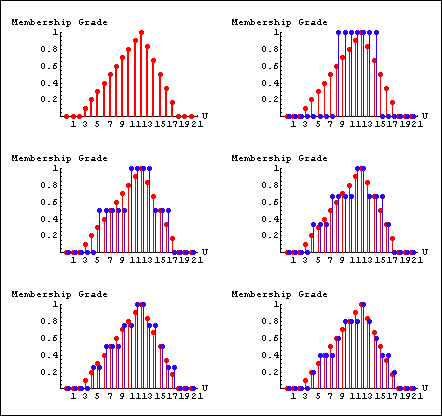
Let us compare the discrete and digital form of our fuzzy sets using the concept of the Hamming distance.
In[54]:=
Out[54]=
As you might expect, as n goes to infinity,  ukasiewicz sets become fuzzy set. ukasiewicz sets become fuzzy set.
2.8.10 Example 9: Image Processing
Problem. The table shows the gray levels values for an 8-bit image associated with an array of 25 pixels. Use the enhancement function on this image to recognize the pattern in the image.
In[55]:=
Solution. An image R of m  n dimensions can be considered as an array of fuzzy singletons, each with a value of membership denoting the gray level in the image. The object of contrast enhancement is to process a given image so that the result is more suitable than the original for a specific application in pattern recognition We will demonstrate enhancement of the image shown in the next figure. First, let's add a function to Fuzzy Logic. n dimensions can be considered as an array of fuzzy singletons, each with a value of membership denoting the gray level in the image. The object of contrast enhancement is to process a given image so that the result is more suitable than the original for a specific application in pattern recognition We will demonstrate enhancement of the image shown in the next figure. First, let's add a function to Fuzzy Logic.
In[56]:=
In[57]:=
In[58]:=
Now, we can plot the image.
In[59]:=
In[60]:=
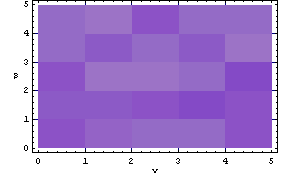
In general, each membership value in fuzzyimage will be modified to a new membership value to enhance the image by the transformation function Contrast. The IntensifyContrast operator applies a Contrast function and intensifies the contrast between the gray levels in the image. As the number of successive applications of the IntensityContrast increases, the slop of the curve gets steeper.
In[61]:=
In[62]:=
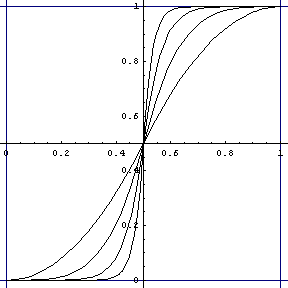
The graphical effect of this recursive transformation for a typical membership function is shown in the next figure where the number of successive applications of the IntensifyContrast function increases from one to three.
In[63]:=
In[64]:=
In[65]:=
In[66]:=
In[67]:=
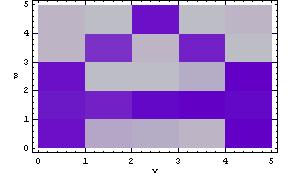
After the original image is processed by the IntensityContrast operator several times, it is undoubtedly more suitable for the subsequent pattern recognition and classification. We hope you recognize the pattern in the image. This is a letter A.
References
A. Kaufmann and M. M. Gupta, Introduction to Fuzzy Arithmetic Theory and Application, Van Nostrand Reinhold, New York, 1991.
G. J. Klir and T. A. Folger, Fuzzy Sets, Uncertainty, and Information, Prentice Hall, Englewood Cliffs, NJ, 1988.
G. J. Klir and Bo Yuan, Fuzzy Sets and Fuzzy Logic: Theory and Applications, Prentice Hall, Upper Saddle River, NJ, 1995.
G. J. Klir, Ute H. St. Clair, and Bo Yuan , Fuzzy Set Theory, Prentice Hall, Upper Saddle River, NJ, 1997.
T. J. Ross, Fuzzy Logic with Engineering Applications, McGraw-Hill, Hightstown, NJ, 1995.
M. S. Stachowicz and M. E. Kochanska, Graphic interpretation of fuzzy sets and fuzzy relations, Mathematics at the Service of Man, Edited by A. Ballester, D. Cardus, and E. Trillas, based on materials of Second World Conf., Universidad Politecnica Las Palmas, Spain, 1982.
H. J. Zimmermann, Fuzzy Set Theory and Its Applications, 3rd ed., Kluwer Academic Publishers, Boston, MA, 1996.
|