|
1.12 Fuzzy Clustering
1.12.1 Introduction
Clustering involves the task of dividing data points into homogeneous classes or clusters so that items in the same class are as similar as possible and items in different classes are as dissimilar as possible. Clustering can also be thought of as a form of data compression, where a large number of samples are converted into a small number of representative prototypes or clusters. Depending on the data and the application, different types of similarity measures may be used to identify classes, where the similarity measure controls how the clusters are formed. Some examples of values that can be used as similarity measures include distance, connectivity, and intensity.
In non-fuzzy or hard clustering, data is divided into crisp clusters, where each data point belongs to exactly one cluster. In fuzzy clustering, the data points can belong to more than one cluster, and associated with each of the points are membership grades which indicate the degree to which the data points belong to the different clusters. This chapter demonstrates the fuzzy c-means clustering algorithm.
This loads the package.
In[1]:=
1.12.2 Fuzzy C-Means Clustering (FCM)
The FCM algorithm is one of the most widely used fuzzy clustering algorithms. This technique was originally introduced by Professor Jim Bezdek in 1981. The FCM algorithm attempts to partition a finite collection of elements X={ , , , ... , , ... , } into a collection of c fuzzy clusters with respect to some given criterion. Given a finite set of data, the algorithm returns a list of c cluster centers V, such that } into a collection of c fuzzy clusters with respect to some given criterion. Given a finite set of data, the algorithm returns a list of c cluster centers V, such that
V =  , i =1, 2, ... , c , i =1, 2, ... , c
and a partition matrix U such that
U =  , i =1, ..., c, j =1,..., n , i =1, ..., c, j =1,..., n
where  is a numerical value in [0, 1] that tells the degree to which the element is a numerical value in [0, 1] that tells the degree to which the element  belongs to the i-th cluster. belongs to the i-th cluster.
The following is a linguistic description of the FCM algorithm, which is implemented Fuzzy Logic. The functions that implement this algorithm can be found in the Clustering.m file.
Step 1: Select the number of clusters c (2  c c  n), exponential weight n), exponential weight  (1 < (1 <  < <  ), initial partition matrix ), initial partition matrix  , and the termination criterion , and the termination criterion  . Also, set the iteration index l to 0. . Also, set the iteration index l to 0.
Step 2: Calculate the fuzzy cluster centers { | i=1, 2, ..., c} by using | i=1, 2, ..., c} by using  . .
Step 3: Calculate the new partition matrix  by using { by using { | i=1, 2, ..., c}. | i=1, 2, ..., c}.
Step 4: Calculate the new partition matrix  = || = || - -  || = || =  | | - -  |. If |. If  > >  , then set l = l + 1 and go to step 2. If , then set l = l + 1 and go to step 2. If    , then stop. , then stop.
We will demonstrate here how to set up and use the clustering functions.


Functions for cluster analysis.
1.12.3 Example
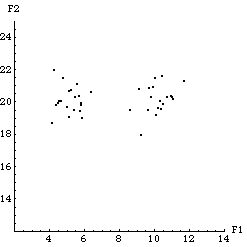
To demonstrate the FCM clustering algorithm, we will create a 2D data set that consists of two groups of data. One group of data is centered around the point {5, 20} and the other is centered around {10, 20}. Below are the functions used to create the data set of 40 points, each of which has two features F1 and F2.
In[2]:=
In[3]:=
In[4]:=
In[5]:=
In[6]:=
Out[6]=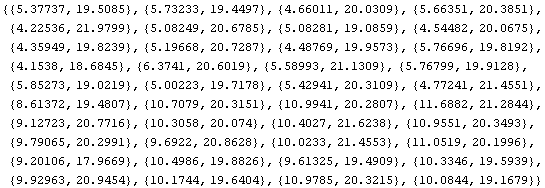
The following is a plot of the data set, which we will use to test the FCM clustering algorithm.
In[7]:=
FCMCluster[data, partmat, mu, epsilon] returns a list of cluster centers, a partition matrix indicating the degree to which each data point belongs to a particular cluster center, and a list containing the progression of cluster centers found during the run. The arguments to the function are the data set (data), an initial partition matrix (partmat), a value determining the degree of fuzziness of the clustering (mu), and a value which determines when the algorithm will terminate (epsilon). This function runs recursively until the terminating criteria is met. While running, the function prints a value that indicates the accuracy of the fuzzy clustering. When this value is less than the parameter epsilon, the function terminates. The parameter mu is called the exponential weight and controls the degree of fuzziness of the clusters. As mu approaches 1, the fuzzy clusters become crisp clusters, where each data point belongs to only one cluster. As mu approaches infinity, the clusters become completely fuzzy, and each point will belong to each cluster to the same degree (1/c) regardless of the data. Studies have been done on selecting the value for mu, and it appears that the best choice for mu is usually in the interval [1.5, 2.5], where the midpoint, mu = 2, is probably the most commonly used value for mu.
We can use the FCMCluster function to find clusters in the data set created earlier. In order to create the initial partition matrix that will be used by the FCMCluster function, we will use the InitializeU function described below.
InitializeU[data, n] returns a random initial partition matrix for use with the FCMCluster function, where n is the number of cluster centers desired. The following is an example using the FCMCluster function to find two cluster centers in the data set created earlier. Notice that the function runs until the terminating criteria goes under 0.01, which is the value specified for epsilon.
In[8]:=


Out[8]=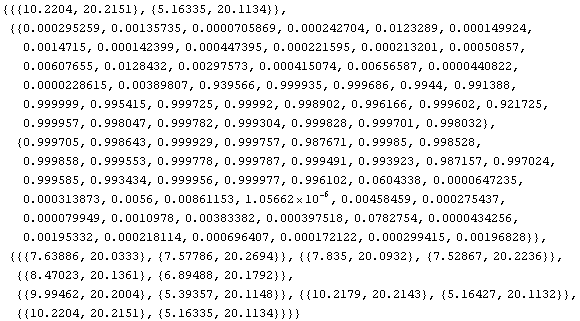
The clustering function should work for data of any dimension, but it is hard to visualize the results for higher order data.
There are two functions in Fuzzy Logic that are useful in visualizing the results of the FCMCluster algorithm, and they are described below.
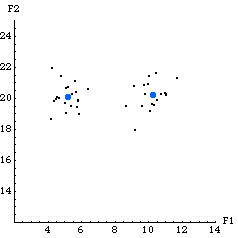
ShowCenters[graph, res] displays a 2D plot showing a graph of a set of data points along with large dots indicating the cluster centers found by the FCMCluster function. The variable graph is a plot of the data points and res is the result from the FCMCluster function.
The following is an example showing the cluster centers found from the previous example. Notice that the cluster centers are located where you would expect near the centers of the two clusters of data.
In[9]:=
Another similar function in Fuzzy Logic is the ShowCenterProgression function.
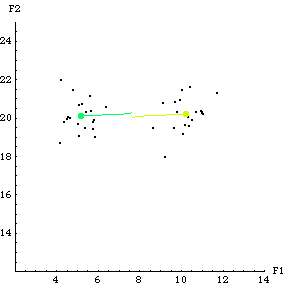
ShowCenterProgression[graph, res] displays a 2D plot showing a graph of a set of data points along with a plot of how the cluster centers migrated during the application of the FCMCluster function. The variable graph is a plot of the data points and res is the result from the FCMCluster function.
The following is the result of the previous example. Notice that the cluster centers start near the center of the data and move to their final spots near the centers of the two data clusters.
In[10]:=
The clustering function just returns cluster centers and the degrees to which the different data points belong to each cluster center. They don't translate directly into membership functions. There are different ways we could turn the cluster centers into membership functions, such as taking the projection of the membership grades of the points onto one of the axes or by just placing fuzzy sets at the cluster centers or some other way.
|