|
1.5 Fuzzy Set Visualization
1.5.1 Introduction
Fuzzy Logic provides a number of functions that can be used to visualize fuzzy sets. In this chapter, we demonstrate these functions and the options associated with each function.
This loads the package.
In[1]:=
1.5.2 Visualization Functions
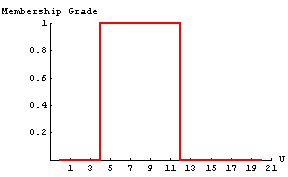
To demonstrate the various fuzzy set graphing functions, we must first create some fuzzy sets to view. We use some of the fuzzy set creation functions from Fuzzy Logic to accomplish this. The following functions create a trapezoidal fuzzy set, a Gaussian fuzzy set, and a crisp set in that order.
In[2]:=
In[3]:=
In[4]:=


Functions to visualize fuzzy sets.
FuzzyPlot[A1, A2, ... , An] plots fuzzy sets A1, A2, ... , An. This function is only for use with fuzzy sets, and the fuzzy sets it graphs must by defined on the same universal space.
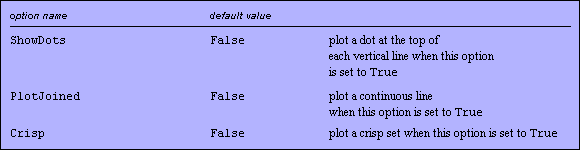
Options for FuzzyPlot.
There are numerous options for this function, which we will demonstrate in the following examples.
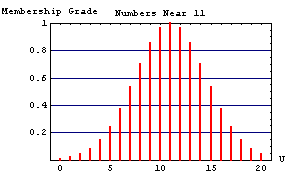
If the FuzzyPlot function is called with one or more fuzzy sets and no options, the function will return a plot of vertical lines with heights representing the membership grades of the corresponding elements.
When more than one fuzzy set is graphed at a time, each successive fuzzy set is graphed in a new color and shifted slightly to the right to avoid overwriting a previous fuzzy set. Therefore, even though a line representing the membership grade is offset to the right of the discrete point on the graph, the line corresponds to the discrete point to the left of the plotted line.
Now let us look at some examples.
In[5]:=
In[6]:=
To resize a graph, click the graph and drag one of the dark squares to a new position.
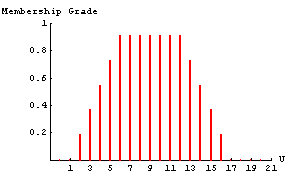
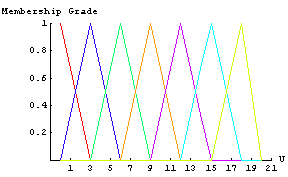
When plotting more than one fuzzy set on the same graph, the FuzzyPlot command uses the following order of colors: red, blue, green, orange, purple, turquoise, yellow, dark pink, light blue, and yellow-green. For more than ten fuzzy sets plotted on the same graph, the color pattern above repeats, so the eleventh fuzzy set will again be red.
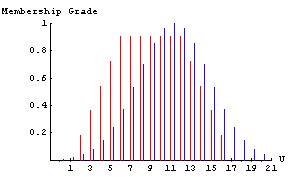
As more and more fuzzy sets are plotted on the same graph, the graph becomes more and more cluttered, and the fuzzy sets become increasingly difficult to distinguish from one another. Setting the ShowDots option to True causes a dot to be placed at the top of each of the vertical lines representing the membership grades. This option sometimes makes it easier to distinguish fuzzy sets in a cluttered graph.
In[7]:=
Even with the ShowDots option set to True, some graphs with multiple fuzzy sets still become too cluttered to easily interpret. Furthermore, if the universal space of the fuzzy sets you are plotting is large, the vertical line-plotting method does not work well. If this is the case, setting the PlotJoined option to True is often your best bet. This will cause the fuzzy sets to be plotted as a continuous line. A linear interpolation is used for the points between the integer elements, and successive fuzzy sets are not offset to the right as is the case for the discrete plots talked about earlier in this section.
In[8]:=
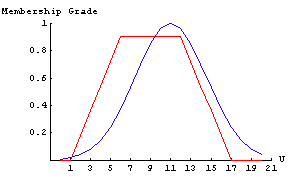
It is often instructive to work with fuzzy sets along with crisp or classical sets. Therefore, Fuzzy Logic includes a graphing option that allows crisp sets to be plotted in an accurate manner. To use the crisp plotting option, set the Crisp option to True. We demonstrate this option by plotting a fuzzy set that is also a crisp set (all membership grades are either 1 or 0).
In[9]:=
In addition to the options mentioned above, the FuzzyPlot function also accepts any of the options that Mathematica's standard Plot function accepts. If the default options for the fuzzy plotting functions do not produce a readable graph, or if you want the graphs presented in a different way, these additional options can be used. Here is a list of the options for Mathematica's Plot function.
 Here is one example that uses some of the standard Mathematica plotting options.
In[10]:=
Another visualization function in the Fuzzy Logic package is a fuzzy graph. A fuzzy graph can be used to give an idea of what a set of fuzzy rules look like.
Let's look at an example to see how the FuzzyGraph function works. The first thing we need is a set of rules that relate fuzzy inputs to fuzzy outputs. We start by creating the fuzzy sets that are used to represent the input and output variables.
In[11]:=
In[12]:=
In[13]:=
In[14]:=
In[15]:=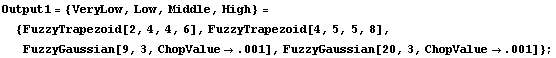
In[16]:=
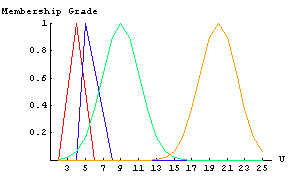
Next we create a set of fuzzy rules relating the inputs to the outputs.
In[17]:=
Now we can use the fuzzy graph function to get a general idea of what the system we created will look like. An expression of the form {Tiny, High} is referred to as a Cartesian granule. In this sense, a fuzzy graph may be viewed as a disjunction of Cartesian granules.
In[18]:=
In this case, we see that the rules we created map to a function that is parabolic in shape. In essence, a fuzzy graph serves as an approximation to a function, which is described in words as a collection of fuzzy if-then rules.
|