|
1.6 Fuzzy Relation Visualization
1.6.1 Introduction
Fuzzy Logic provides a number of functions that can be used to visualize fuzzy relations. In this chapter, we demonstrate these functions and the options associated with each function.
This loads the package.
In[1]:=
1.6.2 Visualization Functions
To demonstrate the various functions for visualizing fuzzy relations, we need first to create some fuzzy relations. We use the FuzzyTrapezoid function here to create two fuzzy relations.
In[2]:=
In[3]:=


Functions to visualize fuzzy relations.
Fuzzy Plot 3D
FuzzyPlot3D[A1, A2, ... , An, opts] plots the fuzzy relations A1, A2, ... , An as a collection of vertical lines with heights representing the membership grades of the elements. This function is only for fuzzy relations, and all of the fuzzy relations A1, A2, ... , An must be defined on the same universal space. Here we demonstrate the function with our two fuzzy relations, Rel1 and Rel2.
In[4]:=
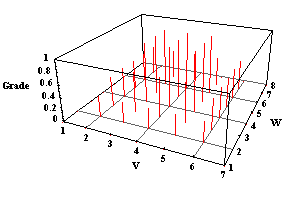
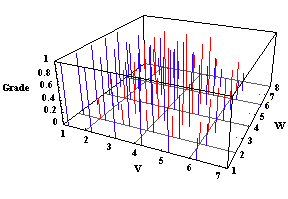
As with fuzzy sets, when multiple fuzzy relations are shown on the same graph, the graph of each successive fuzzy relation is shifted a little to the right along the V axis. Even though there is a shift in the location of each line, the line still corresponds to the discrete point to the left of the plotted line. We can see this in the next example.
In[5]:=
Option for FuzzyPlot3D.
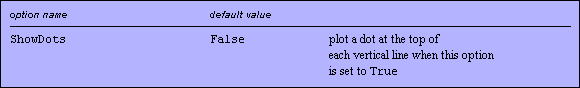
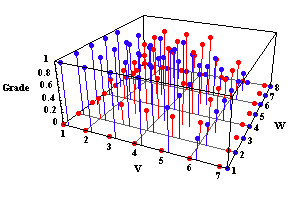
As with fuzzy sets, graphs of multiple fuzzy relations tend to become cluttered, and it becomes difficult to visualize the different fuzzy relations. One option, which may help clear up the graph, is the ShowDots option. When set to True, this option plots a dot at the top of each vertical line. This is shown in the following example.
In[6]:=
Fuzzy Surface Plot
FuzzySurfacePlot[A1, A2, ... , An, opts] displays a surface plot of fuzzy relations A1, A2, ... , An. The discrete plots shown earlier are fairly messy for plotting large fuzzy relations or for plotting multiple fuzzy relations. An alternative graphing solution is to plot fuzzy relations as surfaces. Let's replot the first fuzzy relation as a surface now with the FuzzySurfacePlot function.
In[7]:=
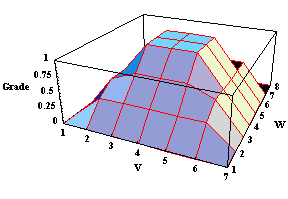
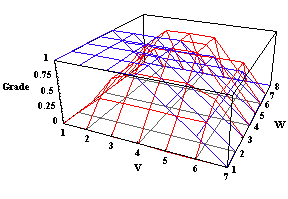
The FuzzySurfacePlot function plots a fuzzy relation as a solid object. Therefore, plotting multiple fuzzy relations on the same surface plot causes some fuzzy relations to block out regions of other fuzzy relations. To get around this problem, the FuzzySurfacePlot function comes with an option that plots the surfaces as meshes rather than solid objects. Setting the HideSurfaces option to True produces a mesh plot. To demonstrate, we will replot the first fuzzy relation with the second fuzzy relation, this time with the HideSurfaces option set to True.
In[8]:=
In addition to the options described in this chapter, the FuzzyPlot3D and FuzzySurfacePlot functions also accept any of the options that Mathematica's standard Plot3D function accepts. Here is a list of these additional options.
AmbientLight Compiled PlotRange
AspectRatio DefaultColor PlotRegion
Axes DefaultFont Plot3Matrix
AxesEdge DisplayFunction Prolog
AxesLabel Epilog Shading
AxesStyle FaceGrids SphericalRegion
Background HiddenSurface Ticks
Boxed Lighting ViewCenter
BoxRatios LightSources ViewPoint
BoxStyle MeshStyle ViewVertical
ClipFill PlotLabel
ColorOutput PlotPoints
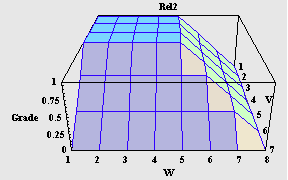
For more information on these options, see The Mathematica Book by Stephen Wolfram. We demonstrate a few of these options in the following example.
In[9]:=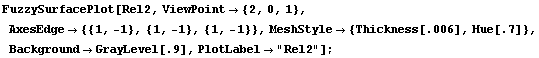
Membership Matrix
One last technique for visualizing a fuzzy relation is to look at its membership matrix. ToMembershipMatrix[A] displays the membership matrix of fuzzy relation A. A membership matrix is a matrix that shows the membership grades of all the elements of a fuzzy relation. This is a convenient way to view fuzzy relations. We demonstrate this function on our first fuzzy relation.
In[10]:=
Out[10]//MatrixForm=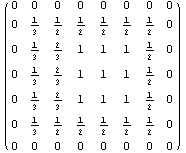
|