|
2.7.1 Transient Circuit Analysis
A Diode Rectifier Circuit
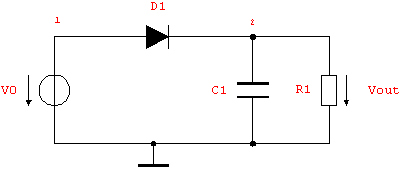
Let's start to demonstrate transient analysis on the half-wave diode rectifier circuit shown in Figure 7.1. This circuit contains both nonlinear as well as dynamic components, namely the diode D1 and the capacitor C1. Given numerical element values and input voltage waveform  we shall compute the transient response we shall compute the transient response  across the load resistor R1. across the load resistor R1.

Figure 7.1: Diode rectifier circuit
As usual, we prepare our circuit analysis by writing a netlist description of the circuit. For the diode, we use the model from the Analog Insydes model data base (Chapter 4.3). The model parameters Is (saturation current) and Vt (thermal voltage) are set to  and and  . The values of the circuit elements are assumed to be . The values of the circuit elements are assumed to be  and and  . .
In[1]:= <<AnalogInsydes`
In[2]:= rectifier =
Circuit[
Netlist[
{V0, {1, 0}, Vin},
{R1, {2, 0}, Symbolic -> R1, Value -> 100.},
{C1, {2, 0}, Symbolic -> C1, Value -> 1.*10^-7},
{D1, {1 -> A, 2 -> C},
Model -> "Diode", Selector -> "Spice",
IS -> 1.*10^-12}
]
]
Out[2]= 
Next, we use the function CircuitEquations to set up a system of nonlinear differential MNA equations in the time domain. In oder to express all voltages and currents as functions of time  and to include time derivatives and to include time derivatives  introduced by dynamic components the option AnalysisMode -> Transient must be specified in the function call. AnalysisMode -> Transient implies MatrixEquation -> False, therefore the equations are written as list of equations regardless of the current setting of MatrixEquation. CircuitEquations returns a Transient DAEObject which can be displayed via the command DisplayForm. introduced by dynamic components the option AnalysisMode -> Transient must be specified in the function call. AnalysisMode -> Transient implies MatrixEquation -> False, therefore the equations are written as list of equations regardless of the current setting of MatrixEquation. CircuitEquations returns a Transient DAEObject which can be displayed via the command DisplayForm.
In[3]:= rectifierMNA = CircuitEquations[rectifier,
AnalysisMode -> Transient];
DisplayForm[rectifierMNA]
Out[4]//DisplayForm= 
This set of modified nodal equations is a typical DAE system. It comprises implicit differential equations as well as both linear and nonlinear algebraic constraints.
The NDAESolve Command
Analog Insydes provides the function NDAESolve for solving DAE systems numerically.
NDAESolve[dae,  tvar, tvar,   , ,    , params , params , opts , opts ] ]
where dae is a DC or Transient DAEObject containing the circuit equations and variables. The argument tvar denotes the time variable for which the solutions are computed in the time interval  , or at the time instant , or at the time instant  . Additionally, params allows for carrying out a parametric analysis. For possible parameter specifications please refer to Section 3.7.2. Finally, opts is a sequence of zero or more solver options of the form option -> value (see Section 2.7.4). . Additionally, params allows for carrying out a parametric analysis. For possible parameter specifications please refer to Section 3.7.2. Finally, opts is a sequence of zero or more solver options of the form option -> value (see Section 2.7.4).
Let's use NDAESolve to compute the transient response  of the diode circuit to a sinusoidal input voltage of the diode circuit to a sinusoidal input voltage  . We choose . We choose  , replace the symbol Vin which denotes the input voltage by the sine function, and integrate the circuit equations numerically with respect to the time variable t from , replace the symbol Vin which denotes the input voltage by the sine function, and integrate the circuit equations numerically with respect to the time variable t from  to to  . .
In[4]:= solutions = NDAESolve[rectifierMNA /. Vin -> Sin[10^6 t],
{t, 0., 2.*10^-5}]
Out[5]= 
Like Mathematica's NDSolve, NDAESolve returns the solutions for the node voltages and currents in terms of InterpolatingFunction objects. This allows for accessing the numerical values of all variables at any point of time in the simulation interval. To obtain the voltages and currents at a certain point of time  , we first have to rewrite the interpolating functions as functions of time. , we first have to rewrite the interpolating functions as functions of time.
In[5]:= functions =
First[solutions] /. Rule[a_, b_] -> Rule[a, b[t]]
Out[6]= 
Then we replace  by a particular value, here by a particular value, here  . This yields the solution vector as a list of rules. . This yields the solution vector as a list of rules.
In[6]:= functions /. t -> 10^-5
Out[7]= 
From the result we can immediately extract the voltage values for  ( ( ) and ) and  ( ( ), as well as the value for the diode current ), as well as the value for the diode current  ( ( ) )

Plotting Transient Waveforms
For graphical display of transient waveforms computed with NDAESolve, Analog Insydes provides the function TransientPlot. With TransientPlot, several interpolating functions can be plotted in a single diagram or displayed as graphics array. The command syntax is
TransientPlot[ numericaldata, numericaldata, vars, vars,  tvar, tvar,  , ,    , opts , opts ] ]
where numericaldata is a list of rules of interpolating functions. The format is compatible to the return value of e.g. NDSolve and NDAESolve (see Section 3.7.1). The argument vars is a list of the variables to be plotted. Besides the variables themselves, this list may also contain mathematical expressions in terms of these variables. The symbol tvar denotes the time variable for which the waveforms are plotted from  to to  . Zero or more options opts can be specified as sequence of rules of the form option -> value (see Section 2.7.6). . Zero or more options opts can be specified as sequence of rules of the form option -> value (see Section 2.7.6).
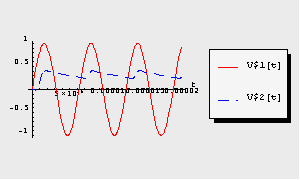
To visualize the transient waveforms of the node voltages V$1 and V$2 in the simulated time interval we can use TransientPlot as shown below. By default, all waveforms are superimposed in one single graph.
In[7]:= TransientPlot[solutions, {V$1[t], V$2[t]},
{t, 0., 2.*10^-5}]

Out[8]= 
Quasi-DC Analysis
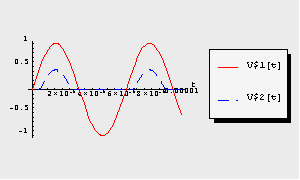
To demonstrate the influence of the capacitor C1 on the output voltage we rerun the simulation, but this time we neglect the dynamic components of the circuit equations. This can be achieved by setting the NDAESolve option AnalysisMode from its default value Transient to DC. The DC analysis method replaces all time derivatives in the circuit equations by zero. Thus, inductors are replaced by short circuits because all inductor voltages are set to zero, and capacitors are replaced by open circuits because all capacitor currents are set to zero.

Let's apply quasi-DC analysis to our rectifier circuit by specifying the above-mentioned option in the call to NDAESolve.
In[8]:= solDC = NDAESolve[rectifierMNA /. Vin -> Sin[10^6 t],
{t, 0., 10^-5}, AnalysisMode -> DC]
Out[9]= 
The influence of the capacitor C1 can be clearly recognized from the plot of the node voltages V$1 and V$2.
In[9]:= TransientPlot[solDC, {V$1[t], V$2[t]}, {t, 0., 10^-5}]

Out[10]= 
|