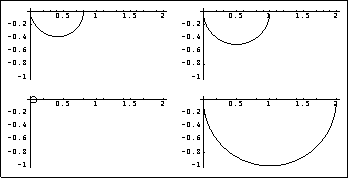
The frequency domain behavior of a system can be examined using the function NyquistArrayPlot. | | plot the direct-system Nyquist array for the object system |
| NyquistArrayPlot[system, {w, wmin, wmax}] |
|
|
| | generate the plot for frequency w running from wmin to wmax |
Creating the Nyquist array plot for direct systems. Make sure the application is loaded. Consider a multivariable system described by a two-input, two-output transfer-function model. | Out[3]= |  |
This plots the direct-system Nyquist array. Clearly, the elements of the array are those that you would expect from the individual elements of the system, and confirm that the complete system is open-loop stable. 
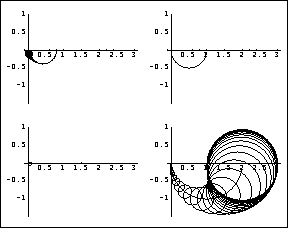
When carrying out a design using the direct-system Nyquist array, the degree of interaction present in the system, and the stability of the closed-loop system with unity feedback applied, is normally assessed by superimposing the Gershgorin circles for column dominance on the diagonal elements of the array, since then any single-loop tuning compensators implemented to complete the design will not change the diagonal dominance of the system. Setting the option GershgorinCircles -> ColumnDominance shows these circles. You can also determine the row diagonal dominance of the system by setting the option GershgorinCircles -> RowDominance. This latter value for this option is more useful for the inverse-system Nyquist array (see Section 5.2.2), since the inverse compensator to be designed manipulates the rows of the Nyquist array. The default is GershgorinCircles -> None. | option name | default value | | | GershgorinCircles | None | which Gershgorin circles to plot |
Option specific to the direct-system and inverse-system Nyquist array plot. This is the same direct-system Nyquist array with the Gershgorin circles for the column dominance criterion. 
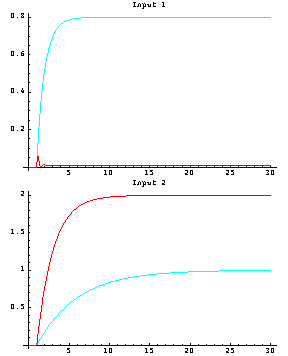
Because the Gershgorin column dominance circles for the low-frequency part of element {1, 1} of the Nyquist array, which starts at 0.8 on the real axis for w = 0, and those for element {2, 2} of the Nyquist array, which starts at 2.0 on the real axis for w = 0, do not enclose the origin, the system is column diagonal dominant at low frequencies. However, element {1, 1} is not column diagonal dominant at the higher frequencies, and the increased size of the Gershgorin circles predicts that some high-frequency interaction will be observed in the time response of output 2 when a step input is applied to input 1. The simulation plot of the open-loop system that follows confirms that. Equally, the initially large size of the Gershgorin circles on element {2, 2} at low frequencies predicts that a significant steady-state response will be generated by output 1 when a step input is applied to input 2. Although the system is open-loop stable, it has a pair of lightly damped poles. | Out[7]= |  |
The system has no right half-plane transmission zeros. | Out[9]= |  |
As the system is open-loop stable and has no right half-plane transmission zeros, there is no nonminimum phase behavior in its open-loop time responses to unit steps applied separately to each system input. 
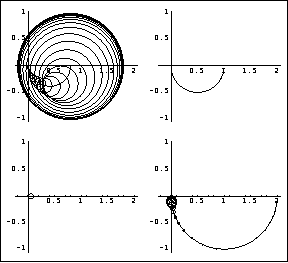
As predicted by the Gershgorin circles on the direct-system Nyquist array, there is a small amount of transient interaction from output 2 when input 1 is applied, and there is a significant steady-state response from output 1 when input 2 is applied. This is the Nyquist array for the row dominance criterion. 
While the closed-loop stability of the system, under unity negative feedback, can be assessed using either the row or column dominance criterion, row 1 of the direct-system Nyquist array is obviously not row diagonal dominant, since the origin is enclosed by several circles. However, it may be possible to improve the row diagonal dominance of the system by using the Perron-Frobenius scaling approach, which is considered later in Section 5.3. NyquistArrayPlot inherits the options of NyquistPlot from Control System Professional. Additionally, you can specify the spacing between the Gershgorin dominance circles and their style using the options CircleSpacing and CircleStyle. The setting CircleSpacing -> n indicates that only one Gershgorin circle must be plotted for every n points on the Nyquist array plot. CircleStyle takes the standard directives, such as Dashing, Hue, and Thickness, or the Automatic value. | option name | default value | | | CircleSpacing
CircleStyle | 5
Automatic | spacing between Gershgorin circles
styles for the Gershgorin circles |
Options specific to the Nyquist array plot. |