While the Gershgorin circles give a useful graphical indication of the row, or column, diagonal dominance present in an open-loop direct, or inverse, system, it is useful to have a simple quantitative indication of the level of diagonal dominance over the frequency range concerned. The column dominance ratio and the row dominance ratio provide these measures. The column dominance ratio is defined as the ratio of the sum of the magnitudes of the off-diagonal terms in the same column, divided by the magnitude of the diagonal term, at a frequency  . The row dominance ratio is similarly defined as the ratio of the sum of the magnitudes of the off-diagonal terms in the same row divided by the magnitude of the diagonal term, at a frequency . The row dominance ratio is similarly defined as the ratio of the sum of the magnitudes of the off-diagonal terms in the same row divided by the magnitude of the diagonal term, at a frequency  . The smaller the dominance ratio is, the lower the interaction is in the system at that frequency; the ideal value being zero. . The smaller the dominance ratio is, the lower the interaction is in the system at that frequency; the ideal value being zero. The functions RowDominanceRatioPlot and ColumnDominanceRatioPlot provide the plots of the respective ratios. | RowDominanceRatioPlot[system] |
| | plot the row dominance ratios of the object system |
| RowDominanceRatioPlot[system, {w, wmin, wmax}] |
|
| | plot the row dominance ratios for frequency w running from wmin to wmax |
Plotting the row dominance ratios. | ColumnDominanceRatioPlot[system] |
| | plot the column dominance ratios of the object system |
| ColumnDominanceRatioPlot[system, {w, wmin, wmax}] |
|
| | plot the column dominance ratios for frequency w running from wmin to wmax |
Plotting the column dominance ratios. Make sure the application is loaded. This is the two-input, two-output multivariable system, introduced in Section 5.2.1. | Out[3]= |  |
This is the direct-system Nyquist array with the Gershgorin circles for the column dominance criterion. 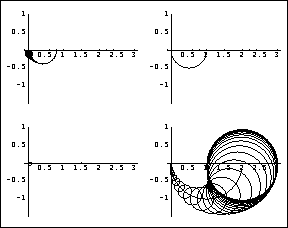
This plots the column dominance ratios of the system, and shows those frequencies over which element {1, 1} of the direct-system Nyquist array looses dominance. 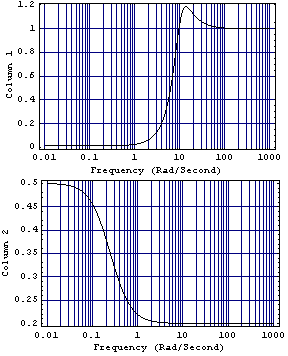
Consider again the state-space model of the reactor system, introduced in Section 5.2.2, with connection of the simple row interchange forward-path compensator. | Out[7]= | 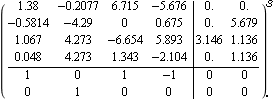 |
This is the inverse-system Nyquist array of this system, with the Gershgorin circles for the row dominance criterion. 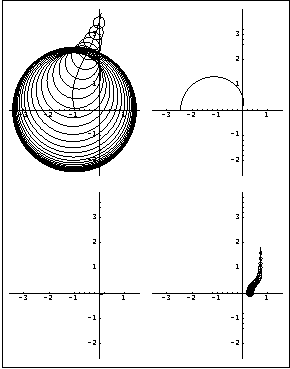
The row dominance ratio plot confirms that element {1, 1} is not diagonal dominant at the lower frequencies, while all elements are diagonal dominant at the higher frequencies. 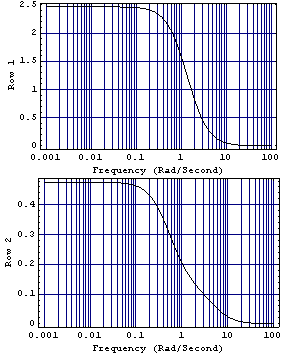
|