|
Plot3D
 Plot3D[f, {x, xmin, xmax}, {y, ymin, ymax}] generates a three-dimensional plot of f as a function of x and y. Plot3D[f, {x, xmin, xmax}, {y, ymin, ymax}] generates a three-dimensional plot of f as a function of x and y.
Plot3D[f, {x, xmin, xmax}, {y, ymin, ymax}, "style"] generates a three-dimensional plot of f in the designated style.
Plot3D[f, {x, xmin, xmax}, {y, ymin, ymax}, "style1", "style2"] generates a three-dimensional plot of f in the primary style, "style1" and the secondary style, "style2"
Primary plot styles for 3D plots include: Default, Technical, Minimal, Business, and Colorful.
Secondary plot styles for 3D plots include: Frame, NoFrame, Grid, NoGrid, SmallPoints, LargePoints, Tall, Wide, ViewLeft, ViewRight, and ViewCenter.
Plot3D[f, {x, xmin, xmax}, {y, ymin, ymax}, {zmin, zmax}] generates a plot of f over the specified z-axis range from zmin to zmax.
Plot3D[f, {x, xmin, xmax}, {y, ymin, ymax}, "style", {zmin, zmax}] combines both specifications for plot style and z-axis range.
See also: ListPlot3D, Plot.
Examples
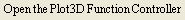
Using InstantCalculators
Here are the InstantCalculators for the Plot3D function. Enter the parameters for your calculation and click Calculate to see the result.
In[1]:=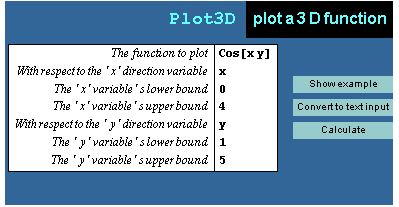
In[2]:=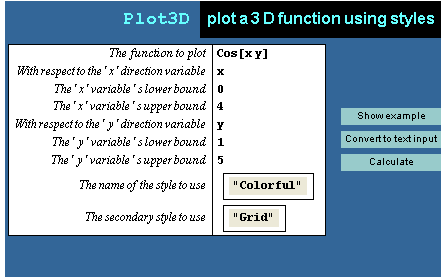
Entering Commands Directly
You can paste a template for this command via the Text Input button on the Plot3D Function Controller.
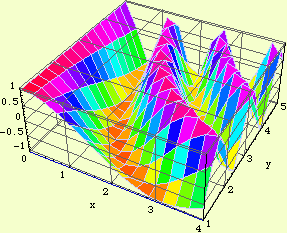
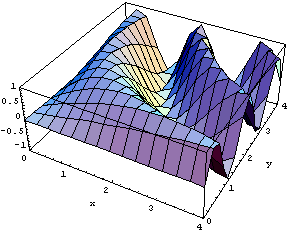
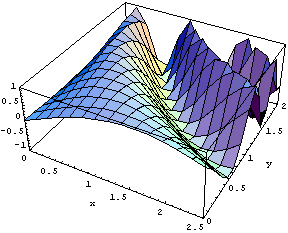
Here are two three-dimensional surface plots.
In[3]:=
In[4]:=
|
