Documentation CalculationCenterFunctionsGraphicsMatrix of Values

|
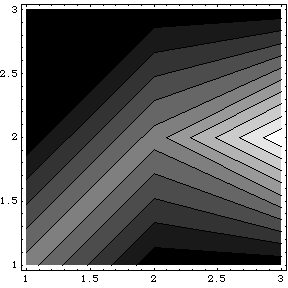
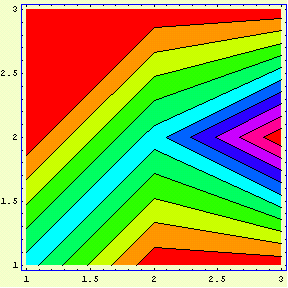
ListContourPlot
 ListContourPlot[array] generates a contour plot from an array of height values. ListContourPlot[array] generates a contour plot from an array of height values.
ListContourPlot[array, {zmin, zmax}] generates a plot of array over the specified z-axis range from zmin to zmax.
Successive rows of array are arranged up the page; successive columns across the page.
See also: ListDensityPlot, ListPlot.

Examples
Using InstantCalculators
Here are the InstantCalculators for the ListContourPlot function. Enter the parameters for your calculation and click Calculate to see the result.
In[1]:=
In[2]:=
You can paste a template for this command via the Text Input button on the ListContourPlot Function Controller.
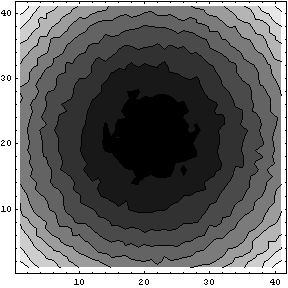
Here is a contour plot of a perturbed cylinder.
In[3]:=
|
