|
Plotting Graphs
|
Use the handy SmartPlot feature to plot graphs of functions or data at the click of a button.
|
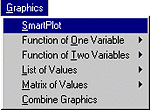
CalculationCenter makes it easy to create graphs of functions or data. It automatically chooses a suitable range and style for the graph and draws the appropriate axes and ticks. Once the graph is drawn, you can customize it as you like.
To plot a graph of any function or data:
1. Type the function or data into a notebook and select it.

2. On the Home controller, click SmartPlot (or use the keyboard shortcut,     S S ). The SmartPlot InstantCalculator for the function is pasted into the notebook. ). The SmartPlot InstantCalculator for the function is pasted into the notebook.
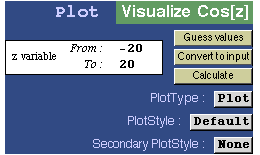
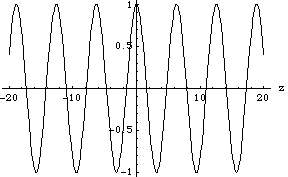
The plot of the function or data appears just below the InstantCalculator. You can modify the range or style of the plot using the InstantCalculator.
|
T I P
 The Graphics menu also includes commands for plotting 3D graphics. You can choose from a variety of formats such as contour and density plots. The Graphics menu also includes commands for plotting 3D graphics. You can choose from a variety of formats such as contour and density plots.
|
To change the style of the plot:
1. Choose a predefined style, such as Technical, from the PlotStyle pop-up menu in the InstantCalculator. You can also choose a secondary plot style such as Frame, NoFrame, or Grid to modify specific features of the graph.
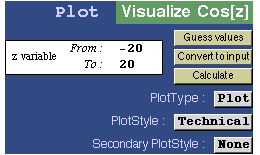
2. Click Calculate to reevaluate and redraw the graph.
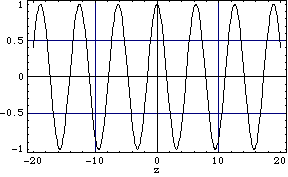
You can also change the format of the plot, such as from linear to log scales, using the PlotType pop-up menu. For data plots, you can draw bar charts and pie charts by choosing the appropriate PlotType. Click Calculate for the changes to take effect.
To change the range or parameters of the graph:
1. In the SmartPlot InstantCalculator, edit the text specifying the range of the variable.
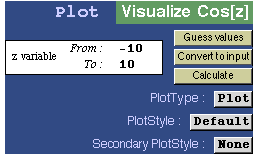
2. Click Calculate to reevaluate and redraw the graph over the new range.
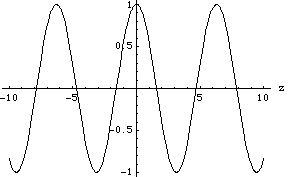
You can also directly edit the command for plotting the graph. Click Convert to input in the SmartPlot InstantCalculator to paste the command in your notebook. Then edit the command and press    to reevaluate it. to reevaluate it.

|