Documentation CalculationCenter
 Other Information
 Tips and Tricks
 Graphics
 Data Plots

|
Data Plots
Plot a List of Values
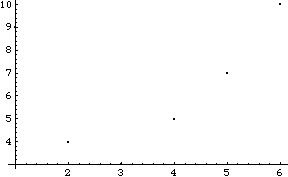
You can use the SmartPlot feature to plot data.
1. Type a list of values and select it.

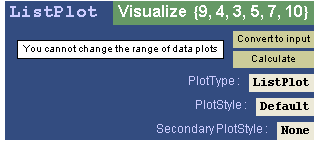
2. Click SmartPlot on the Home Controller or select SmartPlot from the Graphics menu or use the keyboard shortcut for SmartPlot,     s s . The SmartPlot InstantCalculator for the selected function appears and a graph of the function is pasted into the notebook. . The SmartPlot InstantCalculator for the selected function appears and a graph of the function is pasted into the notebook.


3. CalculationCenter automatically chooses an appropriate style for the graph. You can select a different style or plot type from the popup menus provided. Click Calculate to redraw the graph after making any changes.
|
F U R T H E R I N F O R M A T I O N
 You can look at more information on ListPlot. You can look at more information on ListPlot.
|
|


