|
Data Plots
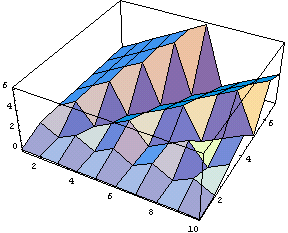
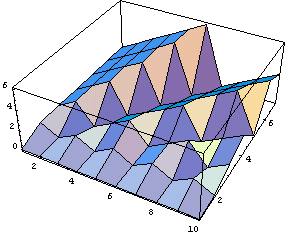
Plot a Matrix of Values
You can use the SmartPlot feature to generate a plot of any matrix.
1. Enter a matrix and select it.


2. Click SmartPlot on the Home Controller or select SmartPlot from the Graphics menu or use the keyboard shortcut for SmartPlot,     s s . The SmartPlot InstantCalculator for the selected function appears and a graph of the function is pasted into the notebook. . The SmartPlot InstantCalculator for the selected function appears and a graph of the function is pasted into the notebook.

3. CalculationCenter automatically chooses an appropriate style for the graph. You can select a different style or plot type from the popup menus provided. Click Calculate to redraw the graph after making any changes.
|
F U R T H E R I N F O R M A T I O N
 You can look at more information on ListPlot3D. You can look at more information on ListPlot3D.
|
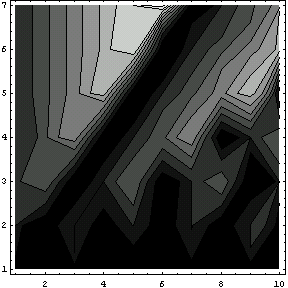
Contour Plot
You can use the SmartPlot feature to generate a contour plot of any matrix.
1. Enter a matrix and select it.


2. Click SmartPlot on the Home Controller or select SmartPlot from the Graphics menu or use the keyboard shortcut for SmartPlot,     s s . The SmartPlot InstantCalculator for the selected function appears and a graph of the function is pasted into the notebook. . The SmartPlot InstantCalculator for the selected function appears and a graph of the function is pasted into the notebook.


3. Click ListPlot and hold until you see the drop-down menu appear. Move the pointer over ListContourPlot and release the mouse button. Click Calculate to recalculate the graph.


4. CalculationCenter automatically chooses an appropriate style for the graph. You can select a different style or plot type from the popup menus provided. Click Calculate to redraw the graph after making any changes.
|
F U R T H E R I N F O R M A T I O N
 You can look at more information on ListContourPlot. You can look at more information on ListContourPlot.
|
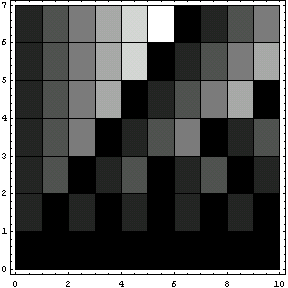
Density Plot
You can use the SmartPlot feature to generate a density plot of any matrix.
1. Enter a matrix and select it.


2. Click SmartPlot on the Home Controller or select SmartPlot from the Graphics menu or use the keyboard shortcut for SmartPlot,     s s . The SmartPlot InstantCalculator for the selected function appears and a graph of the function is pasted into the notebook. . The SmartPlot InstantCalculator for the selected function appears and a graph of the function is pasted into the notebook.


3. Click ListPlot and hold until you see the drop-down menu appear. Move the pointer over ListDensityPlot and release the mouse button. Click Calculate to recalculate the graph.


4. CalculationCenter automatically chooses an appropriate style for the graph. You can select a different style or plot type from the popup menus provided. Click Calculate to redraw the graph after making any changes.
|
F U R T H E R I N F O R M A T I O N
 You can look at more information on ListDensityPlot. You can look at more information on ListDensityPlot.
|
|