|
Data Plots
Plot Styles
When you use SmartPlot, CalculationCenter automatically chooses a default style for the plot. You can customize the style of the plot by choosing a different primary or secondary plot style from the popup menus in the SmartPlot InstantCalculator.
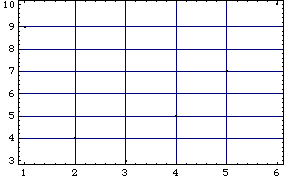
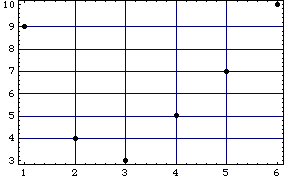
There are five primary styles: Default, Technical, Minimal, Business, and Colorful, each with a set of predefined settings for the axes, grid, frame, point size, colors, fonts etc. After choosing a particular primary style, you can then modify specific features of it by choosing a secondary plot style. Some examples of secondary plot styles are Grid, NoGrid, Frame, No Frame, Tall, and Wide.
Examples of the various styles are given below. You can experiment with the different style choices to find a combination that best suits your needs. Click Calculate to redraw the graph after making any changes.
Default

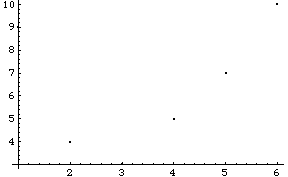
Here is the same graph, redrawn with Secondary PlotStyle set to Frame.

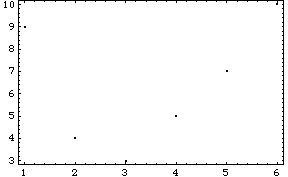
Technical Style

Here is the same graph, redrawn with Secondary PlotStyle set to LargePoints.

Minimal Style


Here is the same graph, redrawn with Secondary PlotStyle set to Wide.


Business Style

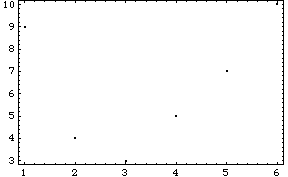
Here is the same graph, redrawn with Secondary PlotStyle set to Grid.

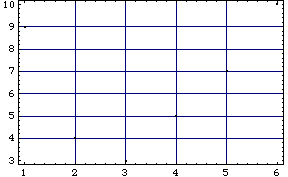
Colorful Style


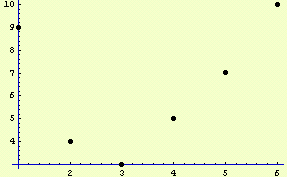
Here is the same graph, redrawn with Secondary PlotStyle set to LargePoints.

|