ContourShading
is an option for contour plots that specifies how the regions between contour lines should be shaded.
Details
- The following settings can be given:
-
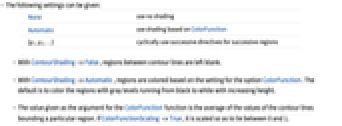
None use no shading Automatic use shading based on ColorFunction {g1,g2,…} cyclically use successive directives for successive regions - With ContourShading->False, regions between contour lines are left blank.
- With ContourShading->Automatic, regions are colored based on the setting for the option ColorFunction. The default is to color the regions with gray levels running from black to white with increasing height.
- The value given as the argument for the ColorFunction function is the average of the values of the contour lines bounding a particular region. If ColorFunctionScaling->True, it is scaled so as to lie between 0 and 1.
Examples
Basic Examples (4)
Shade the regions between contours with colors from the color function:
Leave the regions between contours blank:
Specify an explicit list of colors to shade the regions between contours:
Shade the regions between contours with colors from ColorData:
Text
Wolfram Research (1991), ContourShading, Wolfram Language function, https://reference.wolfram.com/language/ref/ContourShading.html (updated 2007).
CMS
Wolfram Language. 1991. "ContourShading." Wolfram Language & System Documentation Center. Wolfram Research. Last Modified 2007. https://reference.wolfram.com/language/ref/ContourShading.html.
APA
Wolfram Language. (1991). ContourShading. Wolfram Language & System Documentation Center. Retrieved from https://reference.wolfram.com/language/ref/ContourShading.html