Graphics
Graphics[primitives,options]
represents a two-dimensional graphical image.
Details and Options
- Graphics is displayed in StandardForm as a graphical image. In InputForm, it is displayed as an explicit list of primitives.
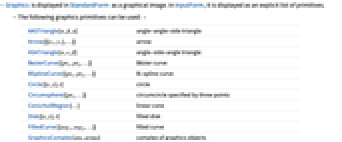
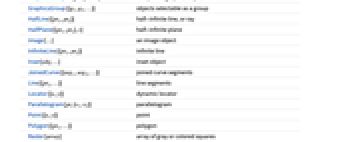
- The following graphics primitives can be used: »
-
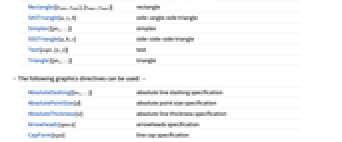
AASTriangle[α,β,a] angle-angle-side triangle Arrow[{{x1,y1},…}] arrow ASATriangle[α,c,β] angle-side-angle triangle BezierCurve[{pt1,pt2,…}] Bézier curve BSplineCurve[{pt1,pt2,…}] B-spline curve Circle[{x,y},r] circle Circumsphere[{pt1,…}] circumcircle specified by three points ConicHullRegion[…] linear cone Disk[{x,y},r] filled disk FilledCurve[{seg1,seg2,…}] filled curve GraphicsComplex[pts,prims] complex of graphics objects GraphicsGroup[{g1,g2,…}] objects selectable as a group HalfLine[{pt1,pt2}] half-infinite line, or ray HalfPlane[{pt1,pt2},v] half-infinite plane Image[…] an image object InfiniteLine[{pt1,pt2}] infinite line Inset[obj,…] inset object JoinedCurve[{seg1,seg2,…}] joined curve segments Line[{pt1,…}] line segments Locator[{x,y}] dynamic locator Parallelogram[pt,{v1,v2}] parallelogram Point[{x,y}] point Polygon[{pt1,…}] polygon Raster[array] array of gray or colored squares Rectangle[{xmin,ymin},{xmax,ymax}] rectangle SASTriangle[a,γ,b] side-angle-side triangle Simplex[{pt1,…}] simplex SSSTriangle[a,b,c] side-side-side triangle Text[expr,{x,y}] text Triangle[{pt1,…}] triangle - The following graphics directives can be used: »
-
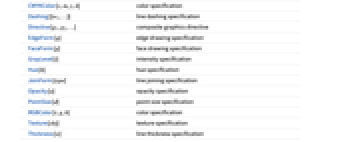
AbsoluteDashing[{w1,…}] absolute line dashing specification AbsolutePointSize[d] absolute point size specification AbsoluteThickness[w] absolute line thickness specification Arrowheads[specs] arrowheads specification CapForm[type] line cap specification CMYKColor[c,m,y,k] color specification Dashing[{w1,…}] line dashing specification Directive[g1,g2,…] composite graphics directive EdgeForm[g] edge drawing specification FaceForm[g] face drawing specification GrayLevel[i] intensity specification Hue[h] hue specification JoinForm[type] line joining specification Opacity[a] opacity specification PointSize[d] point size specification RGBColor[r,g,b] color specification Texture[obj] texture specification Thickness[w] line thickness specification - The following wrappers can be used at any level:
-
Annotation[obj,label] give an annotation Button[obj,action] make obj act as a button Dynamic[obj] use the dynamically updated current value EventHandler[obj,…] attach an event handler Hyperlink[obj,URI] make obj a hyperlink Mouseover[obj,over] specify a mouseover form PopupWindow[obj,cont] attach a popup window StatusArea[obj,label] specify a label to appear in the status area Style[obj,opts] specify a style Tooltip[obj,label] attach a tooltip - The following options can be given:
-
AlignmentPoint Center the default point in the graphic to align with AspectRatio Automatic ratio of height to width Axes False whether to draw axes AxesLabel None axes labels AxesOrigin Automatic where axes should cross AxesStyle {} style specifications for the axes Background None background color for the plot BaselinePosition Automatic how to align with a surrounding text baseline BaseStyle {} base style specifications for the graphic ContentSelectable Automatic whether to allow contents to be selected CoordinatesToolOptions Automatic detailed behavior of the coordinates tool Epilog {} primitives rendered after the main plot FormatType TraditionalForm the default format type for text Frame False whether to put a frame around the plot FrameLabel None frame labels FrameStyle {} style specifications for the frame FrameTicks Automatic frame ticks FrameTicksStyle {} style specifications for frame ticks GridLines None grid lines to draw GridLinesStyle {} style specifications for grid lines ImageMargins 0. the margins to leave around the graphic ImagePadding All what extra padding to allow for labels etc. ImageSize Automatic the absolute size at which to render the graphic LabelStyle {} style specifications for labels Method Automatic details of graphics methods to use PlotLabel None an overall label for the plot PlotRange All range of values to include PlotRangeClipping False whether to clip at the plot range PlotRangePadding Automatic how much to pad the range of values PlotRegion Automatic the final display region to be filled PreserveImageOptions Automatic whether to preserve image options when displaying new versions of the same graphic Prolog {} primitives rendered before the main plot RotateLabel True whether to rotate y labels on the frame Ticks Automatic axes ticks TicksStyle {} style specifications for axes ticks - Nested lists of graphics constructs can be given. Directive specifications such as GrayLevel remain in effect only until the end of the list that contains them. »
- Style[obj,opts] can be used to apply the options or directives opts to obj. »
- The following Method options can be given:
-
"AxesInFront" True whether to draw axes on top of primitives "FrameInFront" True whether to draw the graphics frame on top of primitives "GridLinesInFront" False whether to draw grid lines on top of primitives "TransparentPolygonMesh" False whether bordering polygons should be carefully drawn to avoid double rendering edges - The settings for BaseStyle are appended to the default style typically given by the "Graphics" style in the current stylesheet. The settings for AxesStyle, LabelStyle, etc. are appended to the default styles given for "GraphicsAxes", "GraphicsLabel", etc.
- Graphics[] gives an empty graphic with the default image size.
Examples
open allclose allBasic Examples (2)
Use lines, polygons, circles, etc. to build up a graphics image:
Use plot functions to automatically create Graphics from different types of data:
Scope (13)
Primitives (4)
Graphics primitives are drawn in the order in which they are given in Graphics:
Polygons can fold over themselves:
Vertices can be shared by using GraphicsComplex:
Directives (5)
Directives can specify color and opacity of faces:
Colors, thickness, and dashing directives affect lines, arrows, and edges:
Some primitives have special directives to specify various properties:
Directives can be applied to individual objects using Style:
Graphics directives remain in effect only until the end of the list that contains them:
Options (71)
AlignmentPoint (1)
Specify the coordinates within Inset to be aligned with the center of the enclosing graphic:
AspectRatio (1)
Use numerical values for AspectRatio:
AxesStyle (1)
BaselinePosition (3)
Align the center of a graphic with the baseline of the text:
Specify the baseline of a graphic as a fraction of the height by using Scaled:
ContentSelectable (3)
FormatType (3)
By default, expressions are displayed using TraditionalForm in graphics:
Display expressions using StandardForm:
Labels are also affected by FormatType setting:
FrameLabel (1)
FrameTicks (2)
FrameTicksStyle (2)
GridLines (3)
ImageMargins (3)
Allow no margins outside of ImageSize:
ImagePadding (4)
ImageSize (3)
Method (4)
"FrameInFront" (1)
PlotLabel (2)
Display a label on the top of the graphic in TraditionalForm:
Use Style and other typesetting functions to modify how the label appears:
PlotRange (3)
PlotRangeClipping (2)
PlotRangePadding (3)
Include ![]() coordinate unit of padding on all sides:
coordinate unit of padding on all sides:
Include padding using Scaled coordinates:
PlotRegion (3)
The contents of a graphic use the whole region:
Limit the contents of the graphic to the middle half of the region in each direction:
ImagePadding can also be used to add padding around a graphic:
RotateLabel (2)
Ticks (3)
Properties & Relations (5)
Text
Wolfram Research (1988), Graphics, Wolfram Language function, https://reference.wolfram.com/language/ref/Graphics.html (updated 2022).
CMS
Wolfram Language. 1988. "Graphics." Wolfram Language & System Documentation Center. Wolfram Research. Last Modified 2022. https://reference.wolfram.com/language/ref/Graphics.html.
APA
Wolfram Language. (1988). Graphics. Wolfram Language & System Documentation Center. Retrieved from https://reference.wolfram.com/language/ref/Graphics.html