Histogram3D
Histogram3D[{{x1,y1},{x2,y2},…}]
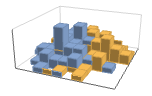
plots a 3D histogram of the values {xi,yi}.
Histogram3D[{{x1,y1},{x2,y2},…},bspec]
plots a 3D histogram with bins specified by bspec.
Histogram3D[{{x1,y1},{x2,y2},…},bspec,hspec]
plots a 3D histogram with bin heights computed according to the specification hspec.
Histogram3D[{data1,data2,…}]
plots 3D histograms for multiple datasets datai.
Details and Options
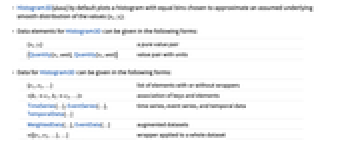
- Histogram3D[data] by default plots a histogram with equal bins chosen to approximate an assumed underlying smooth distribution of the values {xi,yi}.
- Data elements for Histogram3D can be given in the following forms:
-
{xi,yi} a pure value pair {Quantity[xi,unit],Quantity[xi,unit]} value pair with units - Data for Histogram3D can be given in the following forms:
-
{e1,e2,…} list of elements with or without wrappers <k1e1,k2e2,…> association of keys and elements TimeSeries[…],EventSeries[…],TemporalData[…] time series, event series, and temporal data WeightedData[…],EventData[…] augmented datasets w[{e1,e2,…},…] wrapper applied to a whole dataset w[{data1,data1,…},…] wrapper applied to all datasets - The
 width of each bin is computed according to the values xi; the
  width according to the yi.
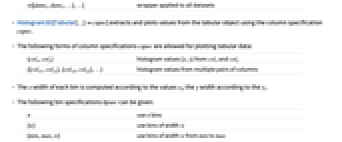
 - The following bin specifications bpsec can be given:
-
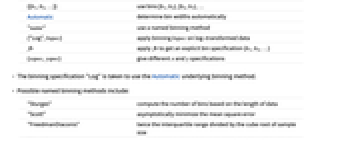
n use n bins {w} use bins of width w {min,max,w} use bins of width w from min to max {{b1,b2,…}} use bins [b1,b2),[b2,b3),… Automatic determine bin widths automatically "name" use a named binning method {"Log",bspec} apply binning bspec on log-transformed data fb apply fb to get an explicit bin specification {b1,b2,…} {xspec,yspec} give different x and y specifications - The binning specification "Log" is taken to use the Automatic underlying binning method.
- Possible named binning methods include:
-
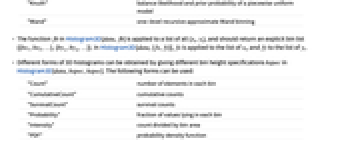
"Sturges" compute the number of bins based on the length of data "Scott" asymptotically minimize the mean square error "FreedmanDiaconis" twice the interquartile range divided by the cube root of sample size "Knuth" balance likelihood and prior probability of a piecewise uniform model "Wand" one-level recursive approximate Wand binning - The function fb in Histogram3D[data,fb] is applied to a list of all {xi,yi}, and should return an explicit bin list {{bx1,bx2,…},{by1,by2,…}}. In Histogram3D[data,{fx,fy}], fx is applied to the list of xi, and fy to the list of yi.
- Different forms of 3D histograms can be obtained by giving different bin height specifications hspec in Histogram3D[data,bspec,hspec]. The following forms can be used:
-
"Count" number of elements in each bin "CumulativeCount" cumulative counts "SurvivalCount" survival counts "Probability" fraction of values lying in each bin "Intensity" count divided by bin area "PDF" probability density function "CDF" cumulative distribution function "SF" survival function "HF" hazard function "CHF" cumulative hazard function {"Log",hspec} log-transformed height specification fh heights obtained by applying fh to bins and counts - The function fh in Histogram3D[data,bspec,fh] is applied to three arguments: a list of
 bins {{bx1,bx2},{bx2,…},…}, a list of
  bins {{by1,by2},{by2,…},…}, and the corresponding 2D array of counts {{c11,c12,…},{c21,…},…}. The function should return an array of heights to be used for each of the cij.
 - Only values {xi,yi} that consist of real numbers are assigned to bins; others are taken to be missing.
- In Histogram3D[{data1,data2,…},…], automatic bin locations are determined by combining all the datasets datai.
- Histogram3D[{…,wi[datai,…],…},…] renders the histogram elements associated with dataset datai according to the specification defined by the symbolic wrapper wi.
- Possible symbolic wrappers are the same as for BarChart3D, and include Style, Labeled, Legended, etc.
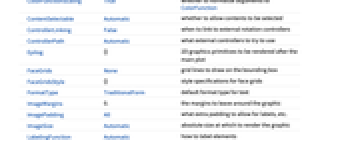
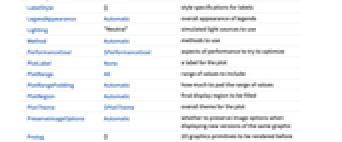
- Histogram3D has the same options as Graphics3D with the following additions and changes: [List of all options]
-
Axes True whether to draw axes BarOrigin Bottom origin of histogram bars BoxRatios {1,1,0.4} bounding 3D box ratios ChartBaseStyle Automatic overall style for bars ChartElementFunction Automatic how to generate raw graphics for bars ChartElements Automatic graphics to use in each of the bars ChartLabels None category labels for datasets ChartLayout Automatic overall layout to use ChartLegends None legends for data elements and datasets ChartStyle Automatic style for bars ColorFunction Automatic how to color bars ColorFunctionScaling True whether to normalize arguments to ColorFunction LabelingFunction Automatic how to label elements LegendAppearance Automatic overall appearance of legends Lighting "Neutral" simulated light sources to use Method Automatic methods to use PerformanceGoal $PerformanceGoal aspects of performance to try to optimize PlotTheme $PlotTheme overall theme for the plot ScalingFunctions None how to scale individual coordinates TargetUnits Automatic units to display in the chart - Possible settings for ChartLayout include "Overlapped" and "Stacked".
- The following settings for ChartLayout can be used to display multiple sets of data:
-
"Overlapped" show all the data overlapping 
"Stacked" accumulate the data per axis - The arguments supplied to ChartElementFunction are the bin region {{xmin,xmax},{ymin,ymax},{zmin,zmax}}, the bin values lists, and metadata {m1,m2,…} from each level in a nested list of datasets.
- A list of built-in settings for ChartElementFunction can be obtained from ChartElementData["Histogram3D"].
- The argument supplied to ColorFunction is the height for each bin.
- With ScalingFunctions->{sx,sy,sz}, the
 coordinate is scaled using sx etc.
 - Style and other specifications from options and other constructs in BarChart are effectively applied in the order ChartStyle, ColorFunction, Style and other wrappers, ChartElements, and ChartElementFunction, with later specifications overriding earlier ones.
-
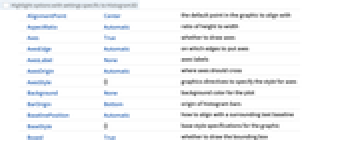
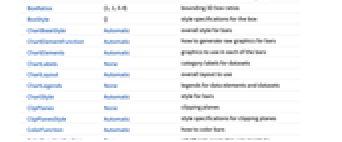
AlignmentPoint Center the default point in the graphic to align with AspectRatio Automatic ratio of height to width Axes True whether to draw axes AxesEdge Automatic on which edges to put axes AxesLabel None axes labels AxesOrigin Automatic where axes should cross AxesStyle {} graphics directives to specify the style for axes Background None background color for the plot BarOrigin Bottom origin of histogram bars BaselinePosition Automatic how to align with a surrounding text baseline BaseStyle {} base style specifications for the graphic Boxed True whether to draw the bounding box BoxRatios {1,1,0.4} bounding 3D box ratios BoxStyle {} style specifications for the box ChartBaseStyle Automatic overall style for bars ChartElementFunction Automatic how to generate raw graphics for bars ChartElements Automatic graphics to use in each of the bars ChartLabels None category labels for datasets ChartLayout Automatic overall layout to use ChartLegends None legends for data elements and datasets ChartStyle Automatic style for bars ClipPlanes None clipping planes ClipPlanesStyle Automatic style specifications for clipping planes ColorFunction Automatic how to color bars ColorFunctionScaling True whether to normalize arguments to ColorFunction ContentSelectable Automatic whether to allow contents to be selected ControllerLinking False when to link to external rotation controllers ControllerPath Automatic what external controllers to try to use Epilog {} 2D graphics primitives to be rendered after the main plot FaceGrids None grid lines to draw on the bounding box FaceGridsStyle {} style specifications for face grids FormatType TraditionalForm default format type for text ImageMargins 0. the margins to leave around the graphic ImagePadding All what extra padding to allow for labels, etc. ImageSize Automatic absolute size at which to render the graphic LabelingFunction Automatic how to label elements LabelStyle {} style specifications for labels LegendAppearance Automatic overall appearance of legends Lighting "Neutral" simulated light sources to use Method Automatic methods to use PerformanceGoal $PerformanceGoal aspects of performance to try to optimize PlotLabel None a label for the plot PlotRange All range of values to include PlotRangePadding Automatic how much to pad the range of values PlotRegion Automatic final display region to be filled PlotTheme $PlotTheme overall theme for the plot PreserveImageOptions Automatic whether to preserve image options when displaying new versions of the same graphic Prolog {} 2D graphics primitives to be rendered before the main plot RotationAction "Fit" how to render after interactive rotation ScalingFunctions None how to scale individual coordinates SphericalRegion Automatic whether to make the circumscribing sphere fit in the final display area TargetUnits Automatic units to display in the chart Ticks Automatic specification for ticks TicksStyle {} style specification for ticks TouchscreenAutoZoom False - whether to zoom to fullscreen when activated on a touchscreen
ViewAngle Automatic angle of the field of view ViewCenter Automatic point to display at the center ViewMatrix Automatic explicit transformation matrix ViewPoint {1.3,-2.4,2.} viewing position ViewProjection Automatic projection method for rendering objects distant from the viewer ViewRange All range of viewing distances to include ViewVector Automatic position and direction of a simulated camera ViewVertical {0,0,1} direction to make vertical
List of all options
Examples
open allclose allBasic Examples (4)
Scope (30)
Data and Layouts (18)
Specify the number of bins to use:
Specify a different number of bins to use in ![]() and
and ![]() :
:
Specify a different bin width to use in ![]() and
and ![]() :
:
Specify different bin delimiters to use in ![]() and
and ![]() :
:
Specify bin delimiters as an explicit list:
Specify different bin delimiters to use in ![]() and
and ![]() :
:
Use different automatic binning methods:
Use logarithmically spaced bins:
Use different height specifications:
Use a height function that accumulates the bin counts over the ![]() direction:
direction:
Bins associated with a dataset are styled the same:
Nonreal data is taken to be missing:
Specify binning spec with units:
The values in an association are used as elements:
The time stamps in TimeSeries, EventSeries, and TemporalData are ignored:
Weights in WeightedData affect the shape of the histogram:
Wrappers (2)
Use wrappers on individual data, datasets, or collections of datasets:
Override the default tooltips:
Use PopupWindow to provide additional drilldown information:
Button can be used to trigger any action:
Styling and Appearance (4)
Use an explicit list of styles for the bars:
Use any gradient or indexed color schemes from ColorData:
ChartBaseStyle can be used to set an initial style for all chart elements:
Style can be used to override styles:
Use any 3D graphic for pictorial bars:
Use built-in programmatically generated bars:
Labeling and Legending (6)
Use Labeled to add a label to a dataset:
Use symbolic positions for label placement:
Provide value labels for bars by using LabelingFunction:
Add categorical legend entries for datasets:
Use Legended to add additional legend entries:
Use Placed to affect the positioning of legends:
Options (43)
ChartBaseStyle (4)
Use ChartBaseStyle to style bars:
ChartBaseStyle combines with ChartStyle:
ChartStyle may override settings for ChartBaseStyle:
ChartBaseStyle combines with Style:
Style may override settings for ChartBaseStyle:
ChartBaseStyle combines with ColorFunction:
ColorFunction may override settings for ChartBaseStyle:
ChartElementFunction (4)
Get a list of built-in settings for ChartElementFunction:
For detailed settings, use Palettes ▶ ChartElementSchemes:
ChartElementFunction appropriate to show the global scale:
Write a custom ChartElementFunction:
Built-in element functions may have options; use Palettes ▶ ChartElementSchemes to set them:
ChartElements (5)
Create a pictorial chart based on any Graphics3D object:
Use a different graphic for each dataset:
Styles are inherited from styles set through ChartStyle etc.:
Use Style to override ChartStyle:
Explicit styles set in the graphic will override other style settings:
ChartLabels (2)
Place dataset labels above each histogram:
Labeled wrappers around datasets will place additional labels:
ChartLayout (2)
ChartLegends (3)
ChartStyle (5)
Use ChartStyle to style bars:
Use "Gradient" colors from ColorData:
Use "Indexed" colors from ColorData:
Style overrides settings for ChartStyle:
ColorFunction overrides settings for ChartStyle:
ChartElements may override settings for ChartStyle:
ColorFunction (4)
Use ColorFunctionScaling->False to get unscaled height values:
ColorFunction overrides styles in ChartStyle:
Use ColorFunction to combine different style effects:
ColorFunctionScaling (2)
By default, scaled height values are used:
Use ColorFunctionScaling->False to get unscaled height values:
LabelingFunction (6)
Use automatic labeling by values through Tooltip and StatusArea:
Use Placed to control label placement:
Control the formatting of labels:
PerformanceGoal (1)
Applications (3)
Create a MatrixPlot from counts extracted from a histogram:
Select a subset of languages available in DictionaryLookup:
Properties & Relations (3)
Histogram3D automatically determines bins to use based on data:
Use BinCounts for explicit binning of data:
Display using BarChart3D:
Use PDF to get parametric probability density function:
Show together with Histogram of random data:
Text
Wolfram Research (2008), Histogram3D, Wolfram Language function, https://reference.wolfram.com/language/ref/Histogram3D.html (updated 2015).
CMS
Wolfram Language. 2008. "Histogram3D." Wolfram Language & System Documentation Center. Wolfram Research. Last Modified 2015. https://reference.wolfram.com/language/ref/Histogram3D.html.
APA
Wolfram Language. (2008). Histogram3D. Wolfram Language & System Documentation Center. Retrieved from https://reference.wolfram.com/language/ref/Histogram3D.html