ImageHistogram
ImageHistogram[image]
plots a histogram of the pixel levels for each channel in image.
ImageHistogram[image,bspec]
uses bin specification bspec.
ImageHistogram[image,bspec,range]
plots the histogram of the pixel values in the given range.
Details and Options
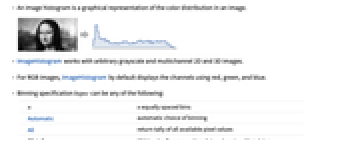
- An image histogram is a graphical representation of the color distribution in an image.
- ImageHistogram works with arbitrary grayscale and multichannel 2D and 3D images.
- For RGB images, ImageHistogram by default displays the channels using red, green, and blue.
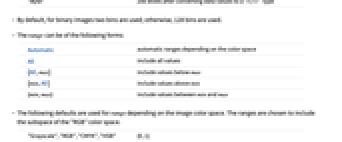
- Binning specification bspec can be any of the following:
-
n n equally spaced bins Automatic automatic choice of binning All return tally of all available pixel values "Byte" 256 levels after converting data values to a "Byte" type - By default, for binary images two bins are used; otherwise, 128 bins are used.
- The range can be of the following forms:
-
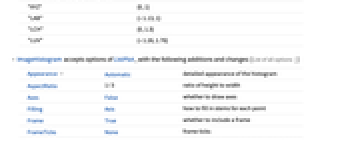
Automatic automatic ranges depending on the color space All include all values {All,max} include values below max {min,All} include values above min {min,max} include values between min and max - The following defaults are used for range depending on the image color space. The ranges are chosen to include the subspace of the "RGB" color space.
-
"Grayscale","RGB","CMYK","HSB" {0,1} "XYZ" {0,1} "LAB" {-1.13,1} "LCH" {0,1.3} "LUV" {-1.26,1.76} - ImageHistogram accepts options of ListPlot, with the following additions and changes: [List of all options]
-
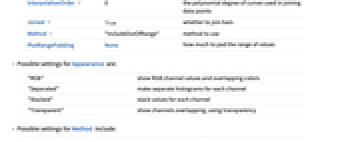
Appearance Automatic detailed appearance of the histogram AspectRatio 1/3 ratio of height to width Axes False whether to draw axes Filling Axis how to fill in stems for each point Frame True whether to include a frame FrameTicks None frame ticks InterpolationOrder 0 the polynomial degree of curves used in joining data points Joined True whether to join bars Method "IncludeOutOfRange" method to use PlotRangePadding None how much to pad the range of values - Possible settings for Appearance are:
-
"RGB" show RGB channel values and overlapping colors "Separated" make separate histograms for each channel "Stacked" stack values for each channel "Transparent" show channels overlapping, using transparency - Possible settings for Method include:
-
"IncludeOutOfRange" values below range in first bin and values above range in last bin "ExcludeOutOfRange" do not count out-of-range values -
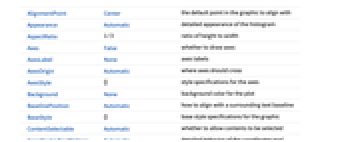
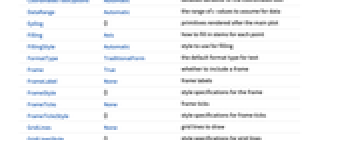
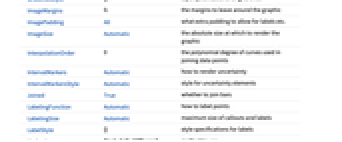
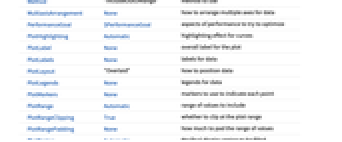
AlignmentPoint Center the default point in the graphic to align with Appearance Automatic detailed appearance of the histogram AspectRatio 1/3 ratio of height to width Axes False whether to draw axes AxesLabel None axes labels AxesOrigin Automatic where axes should cross AxesStyle {} style specifications for the axes Background None background color for the plot BaselinePosition Automatic how to align with a surrounding text baseline BaseStyle {} base style specifications for the graphic ContentSelectable Automatic whether to allow contents to be selected CoordinatesToolOptions Automatic detailed behavior of the coordinates tool DataRange Automatic the range of x values to assume for data Epilog {} primitives rendered after the main plot Filling Axis how to fill in stems for each point FillingStyle Automatic style to use for filling FormatType TraditionalForm the default format type for text Frame True whether to include a frame FrameLabel None frame labels FrameStyle {} style specifications for the frame FrameTicks None frame ticks FrameTicksStyle {} style specifications for frame ticks GridLines None grid lines to draw GridLinesStyle {} style specifications for grid lines ImageMargins 0. the margins to leave around the graphic ImagePadding All what extra padding to allow for labels etc. ImageSize Automatic the absolute size at which to render the graphic InterpolationOrder 0 the polynomial degree of curves used in joining data points IntervalMarkers Automatic how to render uncertainty IntervalMarkersStyle Automatic style for uncertainty elements Joined True whether to join bars LabelingFunction Automatic how to label points LabelingSize Automatic maximum size of callouts and labels LabelStyle {} style specifications for labels Method "IncludeOutOfRange" method to use MultiaxisArrangement None how to arrange multiple axes for data PerformanceGoal $PerformanceGoal aspects of performance to try to optimize PlotHighlighting Automatic highlighting effect for curves PlotLabel None overall label for the plot PlotLabels None labels for data PlotLayout "Overlaid" how to position data PlotLegends None legends for data PlotMarkers None markers to use to indicate each point PlotRange Automatic range of values to include PlotRangeClipping True whether to clip at the plot range PlotRangePadding None how much to pad the range of values PlotRegion Automatic the final display region to be filled PlotStyle Automatic graphics directives to determine styles of points PlotTheme $PlotTheme overall theme for the plot PreserveImageOptions Automatic whether to preserve image options when displaying new versions of the same graphic Prolog {} primitives rendered before the main plot RotateLabel True whether to rotate y labels on the frame ScalingFunctions None how to scale individual coordinates TargetUnits Automatic units to display in the plot Ticks Automatic axes ticks TicksStyle {} style specifications for axes ticks
List of all options
Examples
open allclose allBasic Examples (3)
Scope (6)
Histogram of a grayscale image showing all distinct levels:
Use range specification All to plot the histogram from the minimum to maximum value in the image:
Use a range specification that includes negative values for plotting the histogram:
Options (10)
Appearance (2)
InterpolationOrder (2)
PlotRange (1)
Applications (1)
Properties & Relations (3)
Image histogram can also be computed using Histogram; however, it is slower:
Find the histogram distribution of an image:
ImageHistogram blends alpha channel with black:
Possible Issues (1)
Text
Wolfram Research (2008), ImageHistogram, Wolfram Language function, https://reference.wolfram.com/language/ref/ImageHistogram.html (updated 2014).
CMS
Wolfram Language. 2008. "ImageHistogram." Wolfram Language & System Documentation Center. Wolfram Research. Last Modified 2014. https://reference.wolfram.com/language/ref/ImageHistogram.html.
APA
Wolfram Language. (2008). ImageHistogram. Wolfram Language & System Documentation Center. Retrieved from https://reference.wolfram.com/language/ref/ImageHistogram.html