ListContourPlot3D
ListContourPlot3D[farr]
generates a contour plot from an array farr with values farr[[i,j,k]] at points {k,j,i}.
ListContourPlot3D[{{x1,y1,z1,f1},{x2,y2,z2,f2},…}]
generates a contour plot from values fi at point {xi,yi,zi}.
Details and Options
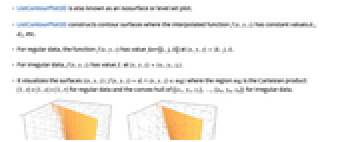
- ListContourPlot3D is also known as an isosurface or level set plot.
- ListContourPlot3D constructs contour surfaces where the interpolated function
 has constant values d1, d2, etc.
 - For regular data, the function
 has value farr[[i,j,k]] at
  .
. - For irregular data,
 has value fi at
  .
. - It visualizes the surfaces
 where the region
  is the Cartesian product
  for regular data and the convex hull of {{x1,y1,z1},…,{xn,yn,zn}} for irregular data.
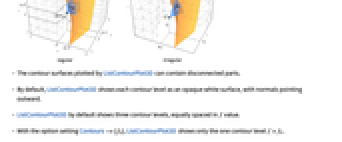
 - The contour surfaces plotted by ListContourPlot3D can contain disconnected parts.
- By default, ListContourPlot3D shows each contour level as an opaque white surface, with normals pointing outward.
- ListContourPlot3D by default shows three contour levels, equally spaced in f value.
- With the option setting Contours->{f0}, ListContourPlot3D shows only the one contour level f=f0.
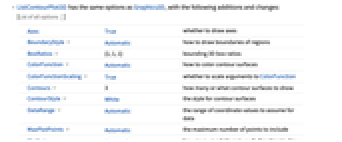
- ListContourPlot3D has the same options as Graphics3D, with the following additions and changes: [List of all options]
-
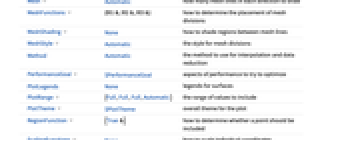
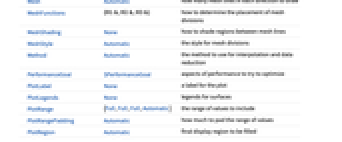
Axes True whether to draw axes BoundaryStyle Automatic how to draw boundaries of regions BoxRatios {1,1,1} bounding 3D box ratios ColorFunction Automatic how to color contour surfaces ColorFunctionScaling True whether to scale arguments to ColorFunction Contours 3 how many or what contour surfaces to show ContourStyle White the style for contour surfaces DataRange Automatic the range of coordinate values to assume for data MaxPlotPoints Automatic the maximum number of points to include Mesh Automatic how many mesh lines in each direction to draw MeshFunctions {#1&,#2&,#3&} how to determine the placement of mesh divisions MeshShading None how to shade regions between mesh lines MeshStyle Automatic the style for mesh divisions Method Automatic the method to use for interpolation and data reduction PerformanceGoal $PerformanceGoal aspects of performance to try to optimize PlotLegends None legends for surfaces PlotRange {Full,Full,Full,Automatic} the range of values to include PlotTheme $PlotTheme overall theme for the plot RegionFunction (True&) how to determine whether a point should be included ScalingFunctions None how to scale individual coordinates TextureCoordinateFunction Automatic how to determine texture coordinates TextureCoordinateScaling True whether to scale arguments to TextureCoordinateFunction - ListContourPlot3D linearly interpolates values to give smooth contours.
- array should be a rectangular array of real numbers; holes will be left in the plot whenever there are elements that are not real numbers.
- ListContourPlot3D[array] by default takes the x, y, and z coordinate values for each data point to be successive integers starting at 1.
- The setting DataRange->{{xmin,xmax},{ymin,ymax},{zmin,zmax}} specifies other ranges of coordinate values to use.
- array can be a SparseArray object.
- The arguments supplied to functions in MeshFunctions and RegionFunction are x, y, z, f. Functions in ColorFunction and TextureCoordinateFunction are by default supplied with scaled versions of these arguments.
- Possible settings for ScalingFunctions include:
-
{sx,sy,sz} scale x, y and z axes - Common built-in scaling functions s include:
-
"Log" 
log scale with automatic tick labeling "Log10" 
base-10 log scale with powers of 10 for ticks "SignedLog" 
log-like scale that includes 0 and negative numbers "Reverse" 
reverse the coordinate direction - ListContourPlot3D returns Graphics3D[GraphicsComplex[data]].
- Themes that affect 3D surfaces include:
-
"DarkMesh" dark mesh lines 
"GrayMesh" gray mesh lines 
"LightMesh" light mesh lines 
"ZMesh" vertically distributed mesh lines 
"ThickSurface" add thickness to surfaces -
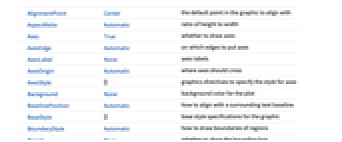
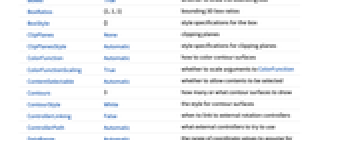
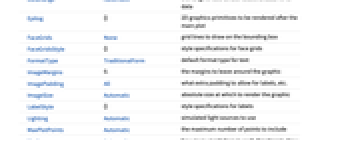
AlignmentPoint Center the default point in the graphic to align with AspectRatio Automatic ratio of height to width Axes True whether to draw axes AxesEdge Automatic on which edges to put axes AxesLabel None axes labels AxesOrigin Automatic where axes should cross AxesStyle {} graphics directives to specify the style for axes Background None background color for the plot BaselinePosition Automatic how to align with a surrounding text baseline BaseStyle {} base style specifications for the graphic BoundaryStyle Automatic how to draw boundaries of regions Boxed True whether to draw the bounding box BoxRatios {1,1,1} bounding 3D box ratios BoxStyle {} style specifications for the box ClipPlanes None clipping planes ClipPlanesStyle Automatic style specifications for clipping planes ColorFunction Automatic how to color contour surfaces ColorFunctionScaling True whether to scale arguments to ColorFunction ContentSelectable Automatic whether to allow contents to be selected Contours 3 how many or what contour surfaces to show ContourStyle White the style for contour surfaces ControllerLinking False when to link to external rotation controllers ControllerPath Automatic what external controllers to try to use DataRange Automatic the range of coordinate values to assume for data Epilog {} 2D graphics primitives to be rendered after the main plot FaceGrids None grid lines to draw on the bounding box FaceGridsStyle {} style specifications for face grids FormatType TraditionalForm default format type for text ImageMargins 0. the margins to leave around the graphic ImagePadding All what extra padding to allow for labels, etc. ImageSize Automatic absolute size at which to render the graphic LabelStyle {} style specifications for labels Lighting Automatic simulated light sources to use MaxPlotPoints Automatic the maximum number of points to include Mesh Automatic how many mesh lines in each direction to draw MeshFunctions {#1&,#2&,#3&} how to determine the placement of mesh divisions MeshShading None how to shade regions between mesh lines MeshStyle Automatic the style for mesh divisions Method Automatic the method to use for interpolation and data reduction PerformanceGoal $PerformanceGoal aspects of performance to try to optimize PlotLabel None a label for the plot PlotLegends None legends for surfaces PlotRange {Full,Full,Full,Automatic} the range of values to include PlotRangePadding Automatic how much to pad the range of values PlotRegion Automatic final display region to be filled PlotTheme $PlotTheme overall theme for the plot PreserveImageOptions Automatic whether to preserve image options when displaying new versions of the same graphic Prolog {} 2D graphics primitives to be rendered before the main plot RegionFunction (True&) how to determine whether a point should be included RotationAction "Fit" how to render after interactive rotation ScalingFunctions None how to scale individual coordinates SphericalRegion Automatic whether to make the circumscribing sphere fit in the final display area TextureCoordinateFunction Automatic how to determine texture coordinates TextureCoordinateScaling True whether to scale arguments to TextureCoordinateFunction Ticks Automatic specification for ticks TicksStyle {} style specification for ticks TouchscreenAutoZoom False - whether to zoom to fullscreen when activated on a touchscreen
ViewAngle Automatic angle of the field of view ViewCenter Automatic point to display at the center ViewMatrix Automatic explicit transformation matrix ViewPoint {1.3,-2.4,2.} viewing position ViewProjection Automatic projection method for rendering objects distant from the viewer ViewRange All range of viewing distances to include ViewVector Automatic position and direction of a simulated camera ViewVertical {0,0,1} direction to make vertical
List of all options
Examples
open allclose allBasic Examples (5)
Scope (6)
Data (5)
For regular data consisting of ![]() values, the
values, the ![]() ,
, ![]() , and
, and ![]() data ranges are taken to be integer values:
data ranges are taken to be integer values:
Provide explicit ![]() ,
, ![]() , and
, and ![]() data ranges by using DataRange:
data ranges by using DataRange:
For irregular data consisting of ![]() triples, the
triples, the ![]() ,
, ![]() , and
, and ![]() data ranges are inferred from data:
data ranges are inferred from data:
Use MaxPlotPoints to limit the number of points used:
Options (64)
BoundaryStyle (3)
Use a red boundary around the edges of the contours:
Use None to omit the boundary:
BoundaryStyle applies to holes cut by RegionFunction:
BoxRatios (3)
ColorFunction (5)
Color the contours according to the ![]() ,
, ![]() ,
, ![]() , or
, or ![]() values:
values:
ColorFunction has higher priority than ContourStyle:
ColorFunction has lower priority than MeshShading:
ColorFunctionScaling (2)
Contours (3)
ContourStyle (7)
Use distinct colors for each contour:
Use FaceForm to get different colors on the inside and outside:
Alternate styles for contour surfaces:
Use the same style for all the contours:
ColorFunction has higher priority than ContourStyle:
MeshShading has higher priority than ContourStyle:
DataRange (3)
MaxPlotPoints (3)
ListContourPlot normally uses all of the points in the dataset:
Limit the number of points used in each direction:
MaxPlotPoints imposes a regular grid on irregular data:
Mesh (6)
Use None to not draw any mesh:
Use five mesh levels in each direction:
Use five mesh levels in the ![]() direction and 10 in the
direction and 10 in the ![]() direction:
direction:
MeshFunctions (2)
MeshShading (5)
Alternate red and blue sections in the ![]() direction:
direction:
MeshShading has higher priority than ContourStyle for styling:
Use ContourStyle for some segments by setting MeshShading to Automatic:
MeshShading can be used with ColorFunction:
MeshStyle (2)
PerformanceGoal (2)
PlotTheme (3)
ScalingFunctions (4)
By default, ContourPlot3D uses linear scales in all directions:
Use a log scale in the ![]() direction:
direction:
Reverse the coordinate direction of the ![]() axis:
axis:
Use a scale defined by a function, specifying the function and its inverse:
TextureCoordinateFunction (5)
Text
Wolfram Research (2007), ListContourPlot3D, Wolfram Language function, https://reference.wolfram.com/language/ref/ListContourPlot3D.html (updated 2022).
CMS
Wolfram Language. 2007. "ListContourPlot3D." Wolfram Language & System Documentation Center. Wolfram Research. Last Modified 2022. https://reference.wolfram.com/language/ref/ListContourPlot3D.html.
APA
Wolfram Language. (2007). ListContourPlot3D. Wolfram Language & System Documentation Center. Retrieved from https://reference.wolfram.com/language/ref/ListContourPlot3D.html