NyquistGridLines
NyquistGridLines
is an option to NyquistPlot that specifies contours of constant magnitude and phase of a closed-loop system.
Details
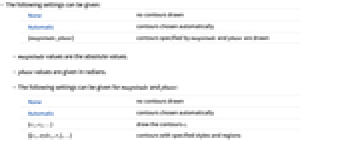
- The following settings can be given:
-
None no contours drawn Automatic contours chosen automatically {magnitude,phase} contours specified by magnitude and phase are drawn - magnitude values are the absolute values.
- phase values are given in radians.
- The following settings can be given for magnitude and phase:
-
None no contours drawn Automatic contours chosen automatically {c1,c2,…} draw the contours ci {{c1,style1,r1},…} contours with specified styles and regions - The default setting for stylei is Dashed for magnitude contours and Dotted for phase contours.
- The setting
 specifies that a point should be included if
  yields True.
 - The default value of
 is True&.
Examples
open allclose allScope (9)
Choose contours automatically:
Show the specified magnitude and phase contours:
Specify contours with magnitude -12 dB, -13 dB, -15 dB, and -18 dB:
Specify contours with phase from -60 to 60 degrees in increments of 10:
The contours depend on the feedback type:
Text
Wolfram Research (2010), NyquistGridLines, Wolfram Language function, https://reference.wolfram.com/language/ref/NyquistGridLines.html.
CMS
Wolfram Language. 2010. "NyquistGridLines." Wolfram Language & System Documentation Center. Wolfram Research. https://reference.wolfram.com/language/ref/NyquistGridLines.html.
APA
Wolfram Language. (2010). NyquistGridLines. Wolfram Language & System Documentation Center. Retrieved from https://reference.wolfram.com/language/ref/NyquistGridLines.html