


PlotTheme
is an option for plotting and related functions that specifies an overall theme for visualization elements and styles.
Details
- PlotTheme->theme effectively sets the default values for multiple plot options.
- Explicit plot options will override any settings set by theme.
- PlotTheme->{theme1,theme2,…} will automatically combine theme1, theme2, etc.
- Possible settings for PlotTheme include:
-
$PlotTheme systemwide theme setting Automatic automatically adapt to background and stylesheet "name" explicit plot theme - Base themes affect the whole visualization and are typically used as a single setting. For special effects or situations, they can be combined with feature themes.
- Common base themes include:
-
"Business" a bright, modern look appropriate for business presentations or infographics 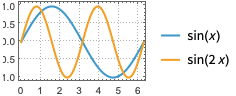
"Detailed" identify data by employing components such as a grid and legend for reports 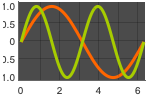
"Marketing" elegant, eye-catching design suitable for marketing needs 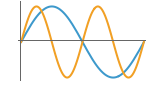
"Minimal" simple data plot without ticks or labels 
"Monochrome" single-color design using dashed lines and plot markers to differentiate datasets for printing and accessibility 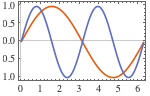
"Scientific" candid design useful for analyzing detailed data without overbearing colors for journals and technical presentations 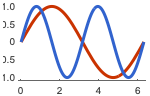
"Web" clean, bold design suitable for a consumer website or blog 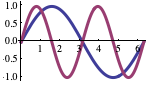
"Classic" historical design of plots to remain compatible with existing uses - Feature themes affect specific aspects of a visualization and are typically used in combination with a base theme or together with other feature themes.
- Axes feature themes affect axes, frames, and grids. Themes include:
-

"NoAxes" no axes or frame 
"MinimalAxes" axes without ticks 
"Grid" only grid lines 
"SingleAxis" bottom axis with height labels 
"FullAxes" axes around the edge 
"Frame" frame with ticks 
"HeightGrid" height grid lines instead of an axis 
"FullAxesGrid" axes with grid lines 
"FrameGrid" frame with grid lines - Color feature themes affect lines and surfaces. Themes include:
-

"BlackBackground" black background with vibrant plot color 
"BackgroundColor" plot colors adapt to notebook background color 
{"BackgroundColor",color} plot colors adapt to background color 
"BoldColor" 12 bold colors 
"CoolColor" 8 cool colors 
"DarkColor" 8 dark colors 
"GrayColor" full range of grayscale colors 
"NeonColor" 8 neon colors 
"PastelColor" 8 pastel colors 
"RoyalColor" 8 royal colors 
"VibrantColor" 10 vibrant colors 
"WarmColor" 8 warm colors - Font feature themes affect axis labels, plot labels, and legends. Themes include:
-

"BoldLabels" bold sans font 
"ItalicLabels" italic serif font 
"LargeLabels" large sans font 
"SmallLabels" small serif font 
"SansLabels" sans font 
"SerifLabels" serif font - Size feature themes affect a visualization's size and shape. Themes include:
-

"Sparkline" text-sized graphics 
"Icon" small, simple graphics 
"Thumbnail" thumbnail-sized graphics 
"Square" square graphics 
"Tall" tall graphics 
"Wide" wide graphics 
"SizeScale" font size and line thickness increase with size - Point marker feature themes affect PlotMarkers. Themes include:
-

"OpenMarkers" open-point marker 
"OpenMarkersThick" thick open-point markers 
"PlotMarkers" alternating closed- and open-point markers - Curve feature themes affect plot lines. Themes include:
-

"ThinLines" thin plot lines 
"MediumLines" medium plot lines 
"ThickLines" thick plot lines 
"DashedLines" dashed plot lines - Surface mesh feature themes affect the mesh of 3D surfaces. Themes include:
-

"DarkMesh" dark mesh lines 
"GrayMesh" gray mesh lines 
"LightMesh" light mesh lines 
"ZMesh" vertically distributed mesh lines - Chart feature themes affect the data's graphic styling. Themes include:
-

"BoldScheme" bold chart elements 
"FadeScheme" faded chart elements - Volume feature themes affect 3D surfaces, which is useful for 3D printing. Themes include:
-

"ThickSurface" add thickness to surfaces 
"FilledSurface" add filling below surfaces
Examples
open all close allBasic Examples (3)
Plot[Evaluate[Table[BesselJ[n, x], {n, 5}]], {x, 0, 10}]Use a monochrome theme with dashed curves:
Plot[Evaluate[Table[BesselJ[n, x], {n, 5}]], {x, 0, 10}, PlotTheme -> "Monochrome"]Use a theme with grid lines and a legend:
Plot[Evaluate[Table[BesselJ[n, x], {n, 5}]], {x, 0, 10}, PlotTheme -> "Detailed"]Scope (9)
Default (1)
Examples with PlotTheme->"Default":
Plot[Evaluate[Table[BesselJ[n, x], {n, 3}]], {x, 0, 10}, PlotTheme -> "Default"]ListPlot[FindClusters[RandomReal[{0, 1}, {2000, 2}], Method -> "GaussianMixture"], PlotTheme -> "Default"]BarChart[Partition[Prime[Range[6]], 3], PlotTheme -> "Default"]DensityPlot[Sin[x]Cos[y], {x, 0, 8}, {y, 0, 8}, PlotTheme -> "Default"]Plot3D[Sin[x y], {x, 0, 3}, {y, 0, 3}, PlotTheme -> "Default"]PieChart[{2, 3, 4}, PlotTheme -> "Default"]AngularGauge[42, {0, 100}, PlotTheme -> "Default"]Graph[Table[jFromDigits[Drop[IntegerDigits[j, 2], -1], 2], {j, 1, 8}], GraphLayout -> "SpringEmbedding", PlotTheme -> "Default"]MeshRegion[[image], PlotTheme -> "Default"]Business (1)
Examples with PlotTheme->"Business":
Plot[Evaluate[Table[BesselJ[n, x], {n, 3}]], {x, 0, 10}, PlotTheme -> "Business"]ListPlot[FindClusters[RandomReal[{0, 1}, {50, 2}], Method -> "GaussianMixture"], PlotTheme -> "Business"]BarChart[Partition[Prime[Range[6]], 3], PlotTheme -> "Business"]DensityPlot[Sin[x]Cos[y], {x, 0, 8}, {y, 0, 8}, PlotTheme -> "Business"]Plot3D[Sin[x y], {x, 0, 3}, {y, 0, 3}, PlotTheme -> "Business"]PieChart[{2, 3, 4}, PlotTheme -> "Business"]AngularGauge[42, {0, 100}, PlotTheme -> "Business"]Graph[Table[jFromDigits[Drop[IntegerDigits[j, 2], -1], 2], {j, 1, 8}], GraphLayout -> "SpringEmbedding", PlotTheme -> "Business"]MeshRegion[[image], PlotTheme -> "Business"]Scientific (1)
Examples with PlotTheme->"Scientific":
Plot[Evaluate[Table[BesselJ[n, x], {n, 3}]], {x, 0, 10}, PlotTheme -> "Scientific"]ListPlot[FindClusters[RandomReal[{0, 1}, {2000, 2}], Method -> "GaussianMixture"], PlotTheme -> "Scientific"]BarChart[Partition[Prime[Range[6]], 3], PlotTheme -> "Scientific"]DensityPlot[Sin[x]Cos[y], {x, 0, 8}, {y, 0, 8}, PlotTheme -> "Scientific"]Plot3D[Sin[x y], {x, 0, 3}, {y, 0, 3}, PlotTheme -> "Scientific"]PieChart[{2, 3, 4}, PlotTheme -> "Scientific"]AngularGauge[42, {0, 100}, PlotTheme -> "Scientific"]Graph[Table[jFromDigits[Drop[IntegerDigits[j, 2], -1], 2], {j, 1, 8}], GraphLayout -> "SpringEmbedding", PlotTheme -> "Scientific"]MeshRegion[[image], PlotTheme -> "Scientific", ImageSize -> 200]Monochrome (1)
Examples with PlotTheme->"Monochrome":
Plot[Evaluate[Table[BesselJ[n, x], {n, 3}]], {x, 0, 10}, PlotTheme -> "Monochrome"]ListPlot[FindClusters[RandomReal[{0, 1}, {100, 2}], Method -> "GaussianMixture"], PlotTheme -> "Monochrome"]BarChart[Partition[Prime[Range[6]], 3], PlotTheme -> "Monochrome"]DensityPlot[Sin[x]Cos[y], {x, 0, 8}, {y, 0, 8}, PlotTheme -> "Monochrome"]Plot3D[Sin[x y], {x, 0, 3}, {y, 0, 3}, PlotTheme -> "Monochrome"]PieChart[{2, 3, 4}, PlotTheme -> "Monochrome"]AngularGauge[42, {0, 100}, PlotTheme -> "Monochrome"]Graph[Table[jFromDigits[Drop[IntegerDigits[j, 2], -1], 2], {j, 1, 8}], GraphLayout -> "SpringEmbedding", PlotTheme -> "Monochrome"]MeshRegion[[image], PlotTheme -> "Monochrome"]Detailed (1)
Examples with PlotTheme->"Detailed":
Plot[Evaluate[Table[BesselJ[n, x], {n, 3}]], {x, 0, 10}, PlotTheme -> "Detailed"]ListPlot[FindClusters[RandomReal[{0, 1}, {500, 2}], Method -> "GaussianMixture"], PlotTheme -> "Detailed"]BarChart[Partition[Prime[Range[6]], 3], PlotTheme -> "Detailed"]DensityPlot[Sin[x]Cos[y], {x, 0, 8}, {y, 0, 8}, PlotTheme -> "Detailed"]Plot3D[Sin[x y], {x, 0, 3}, {y, 0, 3}, PlotTheme -> "Detailed"]PieChart[{2, 3, 4}, PlotTheme -> "Detailed"]AngularGauge[42, {0, 100}, PlotTheme -> "Detailed"]Graph[Table[jFromDigits[Drop[IntegerDigits[j, 2], -1], 2], {j, 1, 8}], GraphLayout -> "SpringEmbedding", PlotTheme -> "Detailed"]MeshRegion[[image], PlotTheme -> "Detailed", ImageSize -> 200]Marketing (1)
Examples with PlotTheme->"Marketing":
Plot[Evaluate[Table[BesselJ[n, x], {n, 3}]], {x, 0, 10}, PlotTheme -> "Marketing"]ListPlot[FindClusters[RandomReal[{0, 1}, {80, 2}], Method -> "GaussianMixture"], PlotTheme -> "Marketing"]BarChart[Partition[Prime[Range[6]], 3], PlotTheme -> "Marketing"]DensityPlot[Sin[x]Cos[y], {x, 0, 8}, {y, 0, 8}, PlotTheme -> "Marketing"]Plot3D[Sin[x y], {x, 0, 3}, {y, 0, 3}, PlotTheme -> "Marketing"]PieChart[{2, 3, 4}, PlotTheme -> "Marketing"]AngularGauge[42, {0, 100}, PlotTheme -> "Marketing"]Graph[Table[jFromDigits[Drop[IntegerDigits[j, 2], -1], 2], {j, 1, 8}], GraphLayout -> "SpringEmbedding", PlotTheme -> "Marketing"]MeshRegion[[image], PlotTheme -> "Marketing", ImageSize -> 200]Classic (1)
Examples with PlotTheme->"Classic":
Plot[Evaluate[Table[BesselJ[n, x], {n, 3}]], {x, 0, 10}, PlotTheme -> "Classic"]ListPlot[FindClusters[RandomReal[{0, 1}, {1000, 2}], Method -> "GaussianMixture"], PlotTheme -> "Classic"]BarChart[Partition[Prime[Range[6]], 3], PlotTheme -> "Classic"]DensityPlot[Sin[x]Cos[y], {x, 0, 8}, {y, 0, 8}, PlotTheme -> "Classic"]Plot3D[Sin[x y], {x, 0, 3}, {y, 0, 3}, PlotTheme -> "Classic"]PieChart[{2, 3, 4}, PlotTheme -> "Classic"]AngularGauge[42, {0, 100}, PlotTheme -> "Classic"]Graph[Table[jFromDigits[Drop[IntegerDigits[j, 2], -1], 2], {j, 1, 8}], GraphLayout -> "SpringEmbedding", PlotTheme -> "Classic"]MeshRegion[[image], PlotTheme -> "Classic"]Minimal (1)
Examples with PlotTheme->"Minimal":
Plot[Evaluate[Table[BesselJ[n, x], {n, 3}]], {x, 0, 10}, PlotTheme -> "Minimal"]ListPlot[FindClusters[RandomReal[{0, 1}, {2000, 2}], Method -> "GaussianMixture"], PlotTheme -> "Minimal"]BarChart[Partition[Prime[Range[6]], 3], PlotTheme -> "Minimal"]DensityPlot[Sin[x]Cos[y], {x, 0, 8}, {y, 0, 8}, PlotTheme -> "Minimal"]Plot3D[Sin[x y], {x, 0, 3}, {y, 0, 3}, PlotTheme -> "Minimal"]PieChart[{2, 3, 4}, PlotTheme -> "Minimal"]AngularGauge[42, {0, 100}, PlotTheme -> "Minimal"]Graph[Table[jFromDigits[Drop[IntegerDigits[j, 2], -1], 2], {j, 1, 8}], GraphLayout -> "SpringEmbedding", PlotTheme -> "Minimal"]MeshRegion[[image], PlotTheme -> "Minimal"]Web (1)
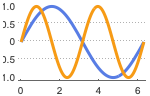
Examples with PlotTheme->"Web":
Plot[Evaluate[Table[BesselJ[n, x], {n, 3}]], {x, 0, 10}, PlotTheme -> "Web"]ListPlot[FindClusters[RandomReal[{0, 1}, {2000, 2}], Method -> "GaussianMixture"], PlotTheme -> "Web"]BarChart[Partition[Prime[Range[6]], 3], PlotTheme -> "Web"]DensityPlot[Sin[x]Cos[y], {x, 0, 8}, {y, 0, 8}, PlotTheme -> "Web"]Plot3D[Sin[x y], {x, 0, 3}, {y, 0, 3}, PlotTheme -> "Web"]PieChart[{2, 3, 4}, PlotTheme -> "Web"]AngularGauge[42, {0, 100}, PlotTheme -> "Web"]Graph[Table[jFromDigits[Drop[IntegerDigits[j, 2], -1], 2], {j, 1, 8}], GraphLayout -> "SpringEmbedding", PlotTheme -> "Web"]MeshRegion[[image], PlotTheme -> "Web"]Text
Wolfram Research (2014), PlotTheme, Wolfram Language function, https://reference.wolfram.com/language/ref/PlotTheme.html (updated 2016).
CMS
Wolfram Language. 2014. "PlotTheme." Wolfram Language & System Documentation Center. Wolfram Research. Last Modified 2016. https://reference.wolfram.com/language/ref/PlotTheme.html.
APA
Wolfram Language. (2014). PlotTheme. Wolfram Language & System Documentation Center. Retrieved from https://reference.wolfram.com/language/ref/PlotTheme.html