PolarGridLines
is an option for sector charts and polar plots that specifies polar grid lines.
Details
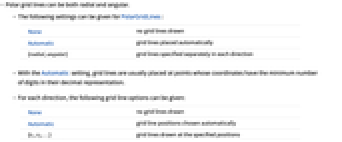
- Polar grid lines can be both radial and angular.
- The following settings can be given for PolarGridLines:
-
None no grid lines drawn Automatic grid lines placed automatically {radial,angular} grid lines specified separately in each direction - With the Automatic setting, grid lines are usually placed at points whose coordinates have the minimum number of digits in their decimal representation.
- For each direction, the following grid line options can be given:
-
None no grid lines drawn Automatic grid line positions chosen automatically {t1,t2,…} grid lines drawn at the specified positions {{t1,style1},…} grid lines with specified styles func a function to be applied to tmin, tmax to get the grid line option - The positions of radial grid lines are specified by angles in radians, measured counterclockwise from the positive
 axis.
axis. - Grid line styles can involve any graphics directives, such as RGBColor and Thickness.
- The grid line function func[tmin,tmax] may return any other grid line option.
- GridLinesStyle gives default styles to use for grid lines.
Examples
open allclose allBasic Examples (4)
Use automatically chosen polar grid lines:
Draw grid lines at the specified positions:
Specify overall grid line style, using GridLinesStyle:
Scope (7)
PolarGridLines Positions (4)
PolarGridLines Styling (3)
Specify the style of each grid line:
Specify overall grid line style, using GridLinesStyle:
Individually styled polar grid lines can be used with GridLinesStyle, and have higher priority:
Text
Wolfram Research (2008), PolarGridLines, Wolfram Language function, https://reference.wolfram.com/language/ref/PolarGridLines.html.
CMS
Wolfram Language. 2008. "PolarGridLines." Wolfram Language & System Documentation Center. Wolfram Research. https://reference.wolfram.com/language/ref/PolarGridLines.html.
APA
Wolfram Language. (2008). PolarGridLines. Wolfram Language & System Documentation Center. Retrieved from https://reference.wolfram.com/language/ref/PolarGridLines.html