
19.1 Curve Fitting
Built into Mathematica TE are various facilities for finding least-squares fits to data. The basic idea of the fits is to take a list of functions that you specify, and try to find a linear combination of them that approximates your data as well as possible. The goodness of fit is measured by the quantity  , where
  is the value of your
 data point, and
  is the value obtained from the fit. The best fit is the one that minimizes
  .
.

The basic form of the Fit function.

Some fits to lists of data.
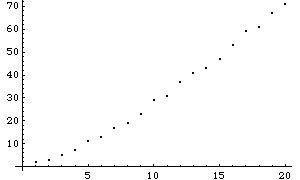
Here is a table of the first 20 primes.
In[1]:= fp = Table[Prime[x], {x, 20}]
Out[1]= 
Here is a plot of this "data".
In[2]:= gp = ListPlot[ fp ]
Out[2]= 
This gives a linear fit to the list of primes. The result is the best linear combination of the functions 1 and x.
In[3]:= Fit[fp, {1, x}, x]
Out[3]= 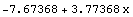
Here is a plot of the fit.
In[4]:= Plot[%, {x, 0, 20}]
Out[4]= 
Here is the fit superimposed on the original data.
In[5]:= Show[%, gp]
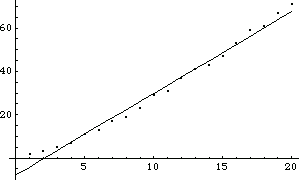
Out[5]= 
This gives a quadratic fit to the data.
In[6]:= Fit[fp, {1, x, x^2}, x]
Out[6]= 
Here is a plot of the quadratic fit.
In[7]:= Plot[%, {x, 0, 20}]

Out[7]= 
This shows the fit superimposed on the original data. The quadratic fit is better than the linear one.
In[8]:= Show[%, gp]

Out[8]= 
Polynomial fits are the most common kind to use. However, if you have a reason to believe that your data follows some other functional form, you can include the appropriate functions in the list you give to Fit.
This gives a table of the values of  for
for  from 1 to 10 in steps of 1.
In[9]:= ft = Table[ N[1 + 2 Exp[-x/3]] , {x, 10}]
Out[9]= 
This fit recovers the original functional form.
In[10]:= Fit[ ft, {1, Exp[-x/3]}, x ]
Out[10]= 
If you include other functions in the list, Fit determines that they occur with small coefficients.
In[11]:= Fit[ ft, {1, Sin[x], Exp[-x/3], Exp[-x]}, x ]
Out[11]= 
You can use Chop to get rid of the terms with small coefficients.
In[12]:= Chop[%]
Out[12]= 
There are several common reasons for doing fits. If you have a particular model for some data, you can do a fit to try and determine the parameters of the model. Another common use of fits is in finding approximate formulas to describe a particular set of data. You can use the form you get from a Fit as a summary of your actual data.
In the examples of Fit so far, the data points you give are assumed to correspond to the results of evaluating a function of one variable when the variable successively takes on values 1, 2, ... . You can also specify data that depends on several variables, each given an arbitrary sequence of values, not necessarily arranged in any kind of regular array.

Ways of specifying data in Fit.
This gives a table of the values of  ,
,  and
and  . You need to use Flatten to get it in the right form for Fit.
In[13]:= Flatten[ Table[ {x, y, 1 + 5x - x y},
{x, 0, 1, 0.4}, {y, 0, 1, 0.4} ], 1]
Out[13]= 
This produces a fit to a function of two variables.
In[14]:= Fit[ % , {1, x, y, x y}, {x, y} ]
Out[14]= 
Using the least-squares criterion, Fit takes the list of functions you give and finds the best fit to your data using these functions. There is absolutely no guarantee that the fit you get will in fact accurately reproduce your data. To find out whether it can, you should use statistical testing functions, such as those in the statistics section of the Mathematica TE library.