
8.4 Options for Plot
When Mathematica TE plots a graph for you, it has to make many choices. It has to work out what the scales should be, where the function should be sampled, how the axes should be drawn, and so on. Most of the time, Mathematica TE will probably make pretty good choices. However, if you want to get the very best possible pictures for your particular purposes, you may have to help Mathematica TE in making some of its choices.
There is a general mechanism for specifying "options" in Mathematica TE functions. Each option has a definite name. As the last arguments to a function like Plot, you can include a sequence of rules of the form name -> value, to specify the values for various options. Any option for which you do not give an explicit rule is taken to have its "default" value.

Choosing an option for a plot.
A function like Plot has many options that you can set. Usually you will need to use at most a few of them at a time. If you want to optimize a particular plot, you will probably do best to experiment, trying a sequence of different settings for various options.
Each time you produce a plot, you can specify options for it. Section 31.1 will also discuss how you can change some of the options, even after you have produced the plot.

Some of the options for Plot. These can also be used in Show.
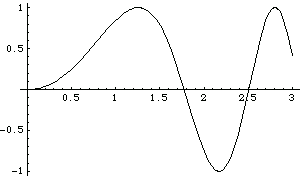
Here is a plot with all options having their default values.
In[1]:= Plot[Sin[x^2], {x, 0, 3}]
Out[1]= 
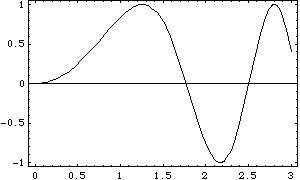
This draws axes on a frame around the plot.
In[2]:= Plot[Sin[x^2], {x, 0, 3}, Frame -> True]
Out[2]= 
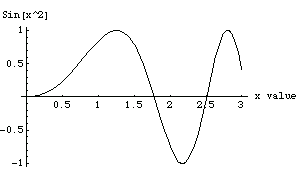
This specifies labels for the  and
and  axes. The expressions you give as labels are printed just as they would be if they appeared as Mathematica TE output. You can give any piece of text by putting it inside a pair of double quotes.
In[3]:= Plot[Sin[x^2], {x, 0, 3},
AxesLabel -> {"x value", "Sin[x^2]"} ]
Out[3]= 
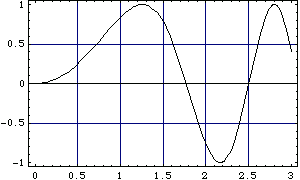
You can give several options at the same time, in any order.
In[4]:= Plot[Sin[x^2], {x, 0, 3}, Frame -> True,
GridLines -> Automatic]
Out[4]= 
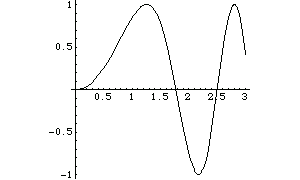
Setting the AspectRatio option changes the whole shape of your plot. AspectRatio gives the ratio of width to height. Its default value is the inverse of the Golden Ratio--supposedly the most pleasing shape for a rectangle.
In[5]:= Plot[Sin[x^2], {x, 0, 3}, AspectRatio -> 1]
Out[5]= 

Some common settings for various options.
When Mathematica TE makes a plot, it tries to set the  and
and  scales to include only the "interesting" parts of the plot. If your function increases very rapidly, or has singularities, the parts where it gets too large will be cut off. By specifying the option PlotRange, you can control exactly what ranges of
  and
and  coordinates are included in your plot.

Settings for the option PlotRange.
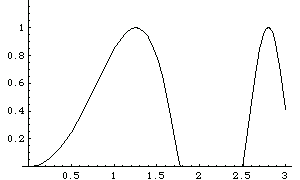
The setting for the option PlotRange gives explicit  limits for the graph. With the
  limits specified here, the bottom of the curve is cut off.
In[6]:= Plot[Sin[x^2], {x, 0, 3}, PlotRange -> {0, 1.2}]
Out[6]= 
Mathematica TE always tries to plot functions as smooth curves. As a result, in places where your function wiggles a lot, Mathematica TE will use more points. In general, Mathematica TE tries to adapt its sampling of your function to the form of the function. However, you can set an option that determines how finely Mathematica TE samples the function.
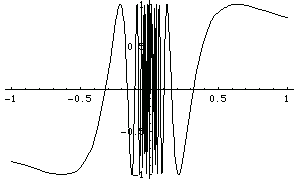
The function  wiggles infinitely often when
  . Mathematica TE tries to sample more points in the region where the function wiggles a lot, but it can never sample the infinite number that you would need to reproduce the function exactly. As a result, there are slight glitches in the plot.
In[7]:= Plot[Sin[1/x], {x, -1, 1}]
Out[7]= 

More options for Plot. These cannot be used in Show.
It is important to realize that since Mathematica TE can only sample your function at a limited number of points, it can always miss features of the function. By increasing PlotPoints, you can make Mathematica TE sample your function at a larger number of points. Of course, the larger you set PlotPoints to be, the longer it will take Mathematica TE to plot any function, even a smooth one.
Since Plot needs to evaluate your function many times, it is important to make each evaluation as quickly as possible. As a result, Mathematica TE usually compiles your function into a low-level pseudocode that can be executed very efficiently. Note that Mathematica TE can only compile "inline code;" it cannot for example compile functions that you have defined. As a result, you should, when possible, use Evaluate as described in Section 8.5 to evaluate any such definitions and get a form that the Mathematica TE compiler can handle.