
Chapter 24
Trigonometry and circles
The functions of trigonometry
We have been using trig functions since we first encountered them in the section The functions of trigonometry back in Chapter 10. First, we continue to look at the trigonometric functions just as any other functions defined on the real line. We will explore the connections with angles a little later, in Radians and degrees.
Here is a brief recap of what we've already seen:
The stars of the show: sine, cosine, tangent
The main functions of trigonometry are sine, cosine, and tangent. Each of these functions is periodic, which means that their graphs consist of repeated copies of one particular curve. The outputs of a periodic function cycle through the same values over and over again. Examples include the hours of daylight each day over the course of a year, the depth of water at a beach due to tides, and the position of the hands on an analog (nondigital) clock.
Here is a quick review of trigonometric function graphs.
The sine function
Here is the sine function, shown as repeated copies of one particular curve:


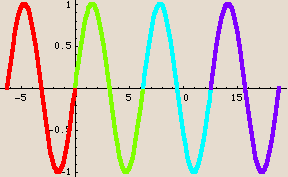
In this case, we get the basic shape of the function by looking just at inputs in the interval  . No smaller interval will give us the entire shape, so the period is 2
 .
.
The cosine function
Here is the cosine function, shown as repeated copies of one particular curve:


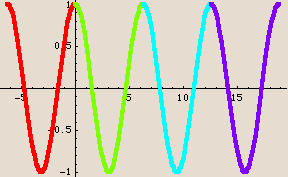
In this case also, we get the basic shape of the function by looking just at inputs in the interval  . No smaller interval will give us the entire shape, so the period of the cosine function also is 2
 .
.
The tangent function
Here is the tangent function, shown as repeated copies of one particular curve:
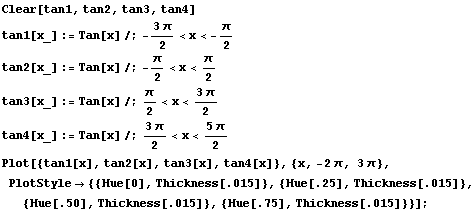


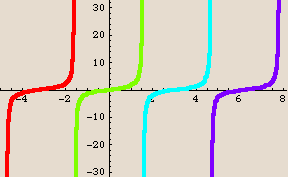
This time we get the basic shape of the function by looking just at inputs in a smaller interval. It looks like it's around 3 units long, but the exact value is  : the interval
  is sufficient. No smaller interval will give us the entire shape, so the period of the tangent function is
  .
.
Notice that the tangent function is not defined at certain input values and, in fact, has vertical asymptotes there. We sometimes say that the tangent function "blows up" at those points. Those points are the odd multiples of  .
.
The supporting characters: secant, cosecant, cotangent
The secant function
Recall that there is an intimate connection between the secant function and the cosine function. We get an idea of that connection by plotting them together. We restrict the range since the secant function blows up--has a vertical asymptote--at the same points as does the tangent function.

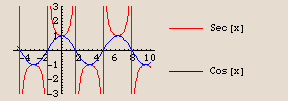
The secant and cosine functions have the same output value when that output is ±1; the secant function gets larger (either positive or negative) as the cosine function gets closer to zero, and the secant function blows up when the cosine function is zero.
In fact, the secant function is just the reciprocal of the cosine function:


Actually, that is how the secant function is defined. Here is a plot of the secant function and the reciprocal of the cosine function together:

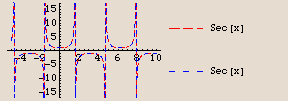
One is right on top of the other. They have the same graph, exactly. They are the same function, exactly.
The cosecant function
Recall also that there is an intimate connection between the cosecant function and the sine function. We plot these two together and we restrict the range since the cosecant function blows up also, but not at the same input values as where the tangent function blows up.

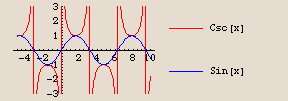
The cosecant and sine functions have the same output value when that output is ±1; the cosecant function gets larger (either positive or negative) as the sine function gets closer to zero, and the cosecant function blows up when the sine function is zero.
In fact, the cosecant function looks like it might actually be the reciprocal of the sine function. We ask you to check this out in the exercises.
The cotangent function
Finally, recall that there is an intimate connection between the cotangent function and the tangent function. We plot these two together, and we restrict the range since both of these functions blow up, although at different input values.

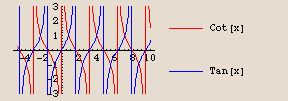
This is more difficult to sort out clearly. The graphs may resemble a plate of thin, colorful spaghetti. However, as with the other combinations, the cotangent and tangent functions have the same output value when that output is ±1; the cotangent function gets larger (either positive or negative) as the tangent function gets closer to zero, and vice-versa; and each function blows up when the other function is zero.
In fact, the cotangent function looks like it might actually be the reciprocal of the tangent function. We ask you to check this out in the exercises.
Tick marks for trig functions
Because quantities involving  show up so frequently with trigonometric functions, sometimes it is convenient to use tick marks involving
  on the horizontal axis. Here is code that defines the option trigticks for the Plot command:

Here are two plots of the sine function. The first one is the more common one; the second one uses trigticks.

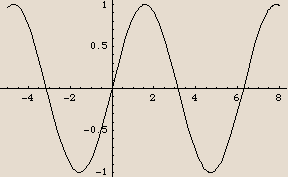
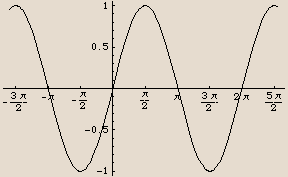
The one with trigticks only gives tick marks that are multiples of  . We will reproduce the code for trigticks later. When you are doing your own work, feel free to copy and paste in the code and then use the trigticks command yourself.
Transformations of trig functions
The graph of  , where
  is sine or cosine


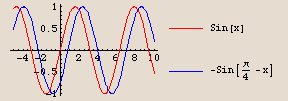
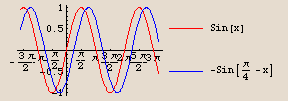
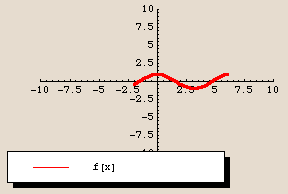
The graph of  is identical to the graph of the sine function, except shifted
  units to the right.
It would be hard to tell that the shift is  units if we only had the plots themselves. Here they are again, using the option trigticks:


The graph of  is identical to the graph of the cosine function, except shifted
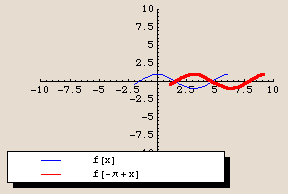
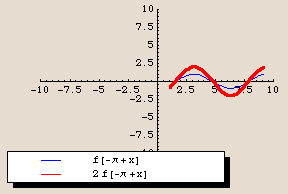
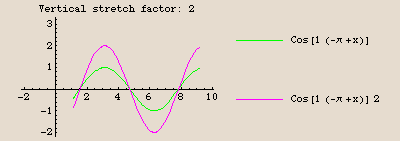
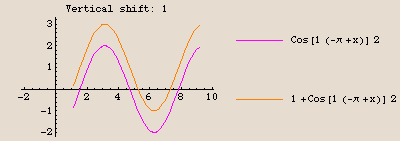
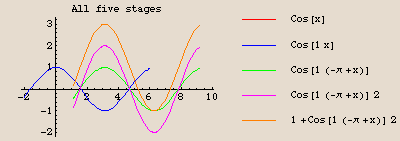
  units to the right, then stretched vertically by a factor of 2, and finally shifted up 1 unit.
This is a more complicated transformation, so we plot the stages separately. Start with  for
for  . We check how the graph of
  compares with the graph of
  . The idea is the same no matter what the starting domain is, but we take
  to be defined just on
  , so the effect of the horizontal shift will be easier to see.
Here are the stages of the transformation:


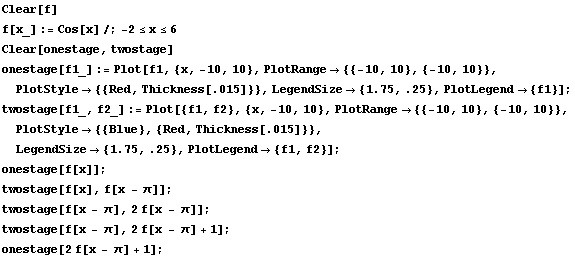
We are going to plot each pair of the stages in turn. The command twostage plots two functions on the same set of axes; the command onestage plots just one. The first plot is just  by itself; the last plot is
  by itself.








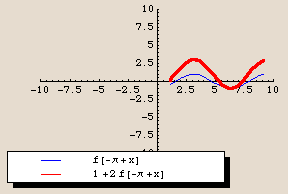


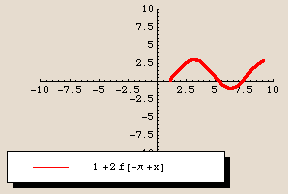
The stages of transformations
How does the graph of  compare with the graph of
  itself, where
  is the sine function or the cosine function?
The answer to that question is the same as in Putting it all together when we looked at transformations of functions in general.
How does the graph of 
compare with the graph of  itself?
The process of changing from the old graph ( ) to the new graph (
 ) takes place in stages. Here are those stages, as presented in Putting it all together.
Input changes
1. Horizontal compression (or stretch), through multiplying by  . This changes the domain, but leaves the range alone.
2. Horizontal shift, through subtracting  . This also changes the domain and leaves the range alone.
So far we have the input  . Now evaluate
  at the input
  to get an output. That's where the basic graph shape comes from.
Output changes
3. Vertical stretch (or compression), through multiplying by the number  . This changes the range, but leaves the domain alone.
4. Vertical shift, through adding  . This also changes the range and leaves the domain alone.
Here is another way to look at it:
Going from  to
to 
Input changes
1. Horizontal compression: from  to
to 
2. Horizontal shift: from  to
to 
Output changes
3. Vertical stretch: from  to
to 
4. Vertical shift: from  to
to 
The general case and finding a good window: FunctionTransformation
Vertical and horizontal stretching can make it difficult to see both plots together. In Shifting and stretching we introduced some Mathematica code that finds a plotting window showing all the stages of the transformation together. We execute the command FunctionTransformation[f,xleft,xright,a,b,h,k] where [xleft,xright] is the interval where we want to plot  .
.
The AT&M-defined Mathematica command FunctionTransformation is defined when you start up AT&M.
Start with the plot of  on a particular interval. We check how the graph of
  compares with the graph of
  .
.
Here are the stages of the transformation:


In an earlier example, we considered the function  for
for  , and we wanted to see how the plot of
  compared with the plot of
  . So we have the function
  , where
  , defined for inputs from xleft =
  to xright = 6.
Also,  is what
  looks like when we take
  ,
,  ,
,  , and
, and  .
.
Those are the values we plug into FunctionTransformation. Check it out:


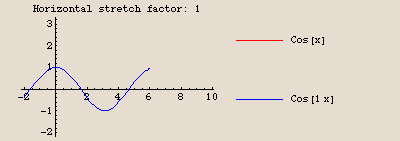
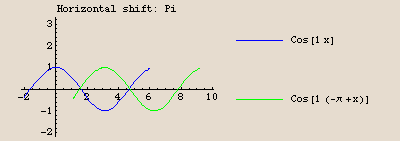


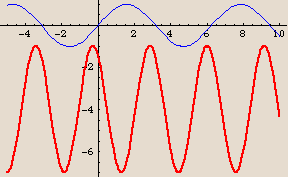
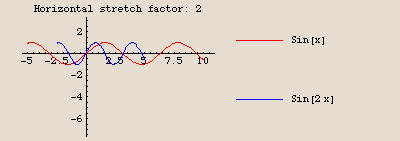
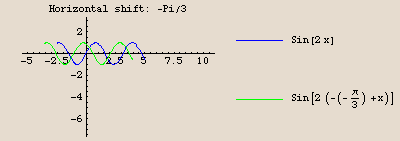
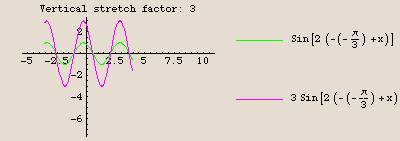
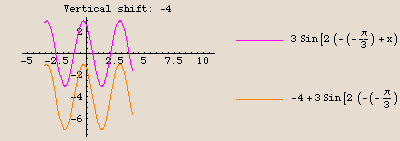
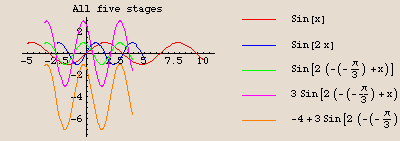
The graph of  is identical to the graph of the sine function, except compressed horizontally by a factor of 2, then shifted
  units to the left, then stretched vertically by a factor of 3, and finally shifted down 4 units.
Here is the sequence of transformations using the command FunctionTransformation. Our original function is  , and our transformed version is
 . Let's start only with inputs in the interval
  , so the effects of the horizontal compression and the horizontal shift will be easier to see.
So  is defined for inputs from xleft
 to xright
 .
.
Also,  is what
  looks like when we take
  ,
,  ,
,  , and
, and  .
.
Those are the values we plug into FunctionTransformation. Check it out:


Envelopes: a special combination
Envelopes
Here is a plot of the function 

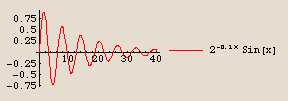
Here is the plot of  , together with plots of
  and
and  :
:

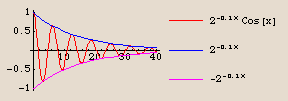
 appears to be sandwiched between the two other functions. What's going on here?
The explanation lies in how the cosine function behaves: it oscillates endlessly between a minimum value of  and a maximum value of
  . Our function
  is written as a product of two factors: a cosine factor and an exponential factor. How does the output for the function
  behave?
When the cosine factor has the value  , the entire output for the function
  equals the value of the exponential factor. When the cosine factor has the value
  , the entire output for the function
 is exactly the opposite of the value of the exponential factor. Halfway in between each of those extremes, the cosine factor is zero, which makes the entire output for the function
  zero also.
Finally, in between all of those input values, the cosine function smoothly changes: down from  to
to  to
to  , then back up from
  to
to  to
to  , and so on. As this happens, the output for the entire function
  smoothly changes also: down from exactly the value of the exponential factor, to
  , to the opposite of the exponential factor, then back up from the opposite of the exponential factor to
  , on up to exactly the exponential factor again, and so on.
The exponential factor and its opposite,  and
and  , are said to form an envelope for
  .
.
Periodic or not?
We just saw the graph of the function  . Its graph oscillates back and forth.

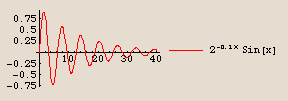
Is this function periodic?
No, it is not periodic. It does oscillate back and forth. In fact, it takes a change in input of exactly 2 to go from one apparent "cycle" to the next.


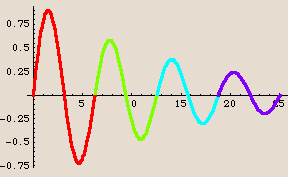
But the overall function is not periodic because the pieces are not identical: as the input increases, the size of the pieces (as measured by the size of the output values) is decreasing. A periodic function is made up of identical pieces.
The cosine is just a horizontal shift of the sine
The similarity of the sine and cosine curves is not your imagination. They are exactly the same curve, just shifted horizontally. Check it out:

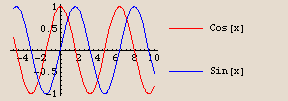
How large is the horizontal shift? Let's see if we can determine with our special trig tickmarks:

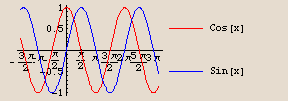
The cosine curve appears to be the same as the sine curve, but shifted  units to the left. Let's see:

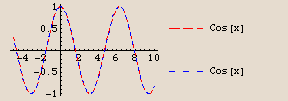
A perfect fit. In fact, Mathematica even recognizes that they're the same, and simplifies the legend for  to just read "Cos[x]." Let's check that algebraically:


Yes. That confirms it.
Special names: amplitude, period, phase shift
There are some special names used with special transformations of the sine and cosine functions. The special transformations are those of the form:

The special names are: amplitude, period, and phase shift. In the following, we show how they fit together.
Amplitude
The amplitude is just the quantity  .
.
Here is an example.
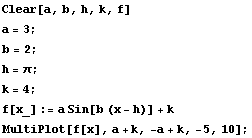
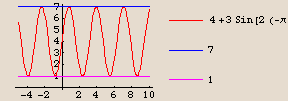
The maximum output is 7 and the minimum output is 1. We have  =
=  = 3. This happens to be exactly the value of the number
  . Is this an accident? (Remember the often-repeated theme: Are you kidding? In mathematics there are no accidents.) Try it and see:
Replay:
Try this again with different choices for  ,
,  ,
,  , and
, and  . Make a plot of
  ; see if the amplitude equals the number
  .
.
Question: What happens if the number  turns out to be negative?
If the number  turns out to be negative, then the graph is upside down along the horizontal axis.
Period
The period is the shortest interval over which the function runs through one complete cycle of its graph.
Here is an example:
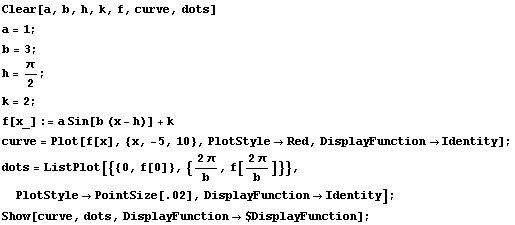
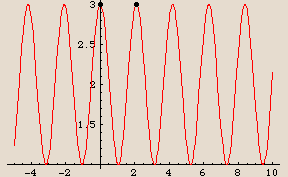
The two dots appear to mark off exactly one cycle of the graph. They are placed at the points  and
and  . That makes the period exactly
  . Is this an accident? (Remember the often-repeated theme: Are you kidding? In mathematics there are no accidents.) Try it and see:
Replay:
Try this again with different choices for  ,
,  ,
,  , and
, and  . Make a plot of
  ; see if the period equals the number
  .
.
Phase shift
The phase shift is the horizontal shift away from the standard graph of the sine function or of the cosine function, whichever you have.
Here is an example:
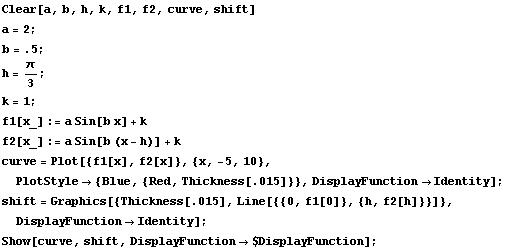
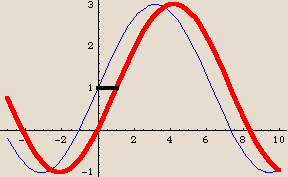
The thick horizontal line shows the phase shift. It extends from  to
to  . That makes the phase shift exactly
  units. Is this an accident? Try it and see:
Replay:
Try this again with different choices for  ,
,  ,
,  , and
, and  . Make a plot of
  ; see if the phase shift equals the number
  .
.
Notice that the phase shift is determined by comparing the fully transformed curve with the partly transformed sine curve that has the same amplitude and period.
This should not be surprising. Referring back to Composition patterns: Putting it all together, we learned that  causes a horizontal shift when one compares the graph of
  with the graph of
  itself.
The word phase shift for trigonometric functions means exactly the same as horizontal shift for other functions.