Area Between Two Curves
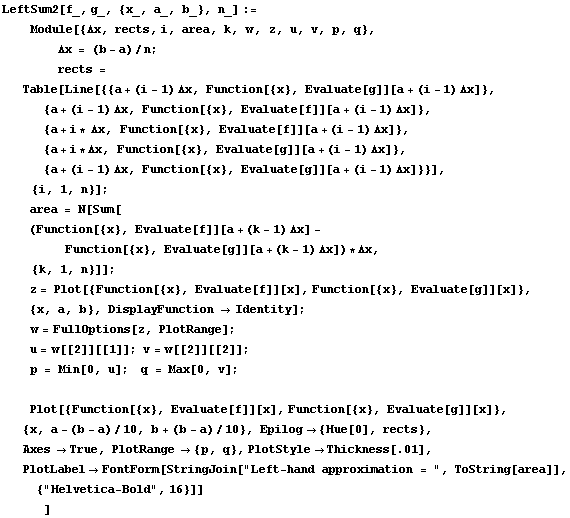
I used the following notebook to demonstrate the concept of the area between two curves with my AP AB Calculus class. After executing the first command in this notebook, you will be asked "Do you want to automatically evaluate all the initialization cells in the notebook?" Click Yes, and Mathematica will automatically execute the commands under "Initialization Code." It will load the FilledPlot command and define the LeftSum2 function.
The FilledPlot command draws a list of functions and fills in the area between them, so it is wonderful for drawing the regions involved.

The LeftSum2 command draws the left-hand approximation of the area using a specified number of subdivisions. The arguments are the top function, the bottom function, the domain specification, and the number of subdivisions.


I used the Table command to draw a series of left-hand approximations with an increasing number of subdivisions. Mathematica will animate the graphics in a flip-book fashion when you double-click any of the graphics generated. The presentation is a bit tidier if you close the group of cells containing all the graphics using the brackets on the far right-hand side of the screen, but that is not necessary.
The animation reinforces the concept that as the number of subdivisions increases, the accuracy of the approximation improves.

Initialization Code

