
Technical Report: Conic Sections
Student Name:

Directions
For each type of conic section, present a real world example applying to the specific section. Each of your examples should contain:
 A DESCRIPTION of the problem. If you use a problem from a book or online reference make sure to cite the reference that was your source for the problem.
 An explanation of the EQUATION you are using for your example.
 A GRAPH of the equation, with a description of the variables used in the input commands for your graph. The easiest technique for generating a graph will be to open the Conic Section Mathematica notebooks used during this unit, and simply copy and paste the input lines for each type of problem.
 Describe the CONCLUSIONS you may draw about your graph.
Examples
Circle Example Problem
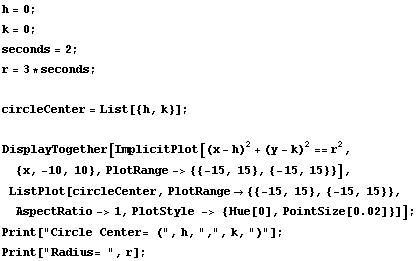
Description: When a dying star collapses, the pressure and heat generated causes a massive explosion called a supernova. The light produced by this explosion travels from the supernova in all directions at the speed of light, about 300,000 km/sec. (Focus on Advanced Algebra, 1996, Addison-Wesley: Menlo Park, California, p.377, no. 26)
Equation: The outer edge of light from the supernova can be represented by the equation  (there are no h and k values in this problem because the center of the supernova can be called point (0,0)). In this problem
  is really 300,000 times the number of seconds that have passed. So the equation of the edge of light is really
  . The number of seconds will need to be inputted into the problem.
Graph: The following is a graph of the path of the edge of light coming out from the supernova. The x-axis represents time in seconds, the y-axis represents distance in kilometers (this distance has been divided by 100,000 so that the graph is a reasonable size.) The graph shows the edge of light after 2 seconds.
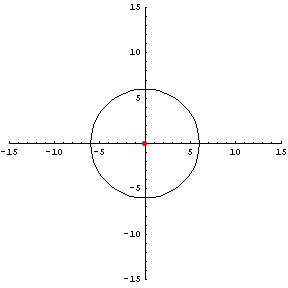


Conclusion: After 2 seconds the light would have traveled 6 km.
Ellipse Example Problem
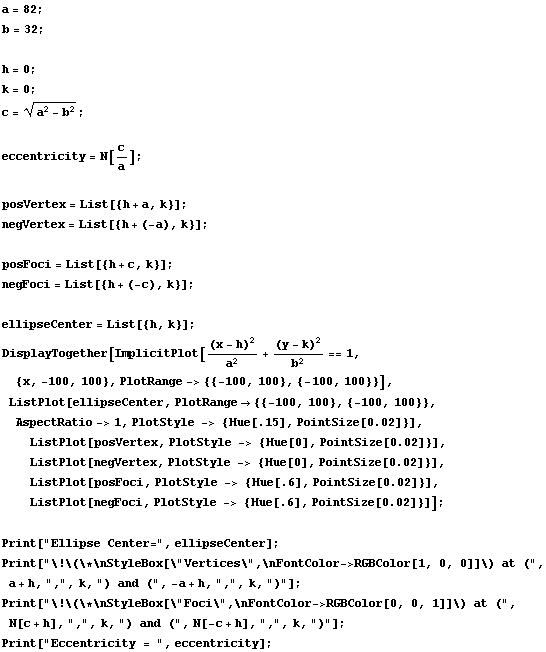
Description: When runners run on a track they travel a distance of 400 meters. This ellipse has the major axis on the x-axis, and is 82 meters from the center. The minor axis is the y-axis, and is 32 meters from the center.
Equation: With the dimensions listed above, the equation of the ellipse of a running track would be  where a is 82 meters and b is 32 meters. Therefore, the equation of the line is really
  .
.
Graph: The following is a graph of a running track with a length of 164 meters (82+82) and a width of 64 meters (32+32). The circumference of the ellipse is approximately 400 meters.
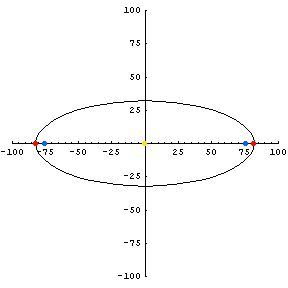


Conclusion: A typical track is not really an ellipse. This particular ellipse is a somewhat flat ellipse, with an eccentricity measurement of 0.92. The flatter this ellipse gets, the closer the eccentricity will be to one. The rounder the ellipse gets the closer the eccentricity will be to zero.
Hyperbola Example Problem
Description: Most modern lighthouses have double beams that send light out from the lighthouse in a hyperbolic orientation. This problem graphs the beams of light extending out from a lighthouse that is 30 feet high.
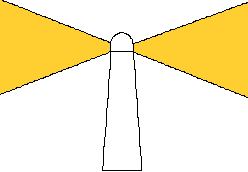
Equation: The top of the lighthouse is 30 feet off the ground and the light casts a beam with a y-radius (b) of 5. The equation of the line representing the hyperbolic beam of light coming from the lighthouse is  where
where  and
and  .
.
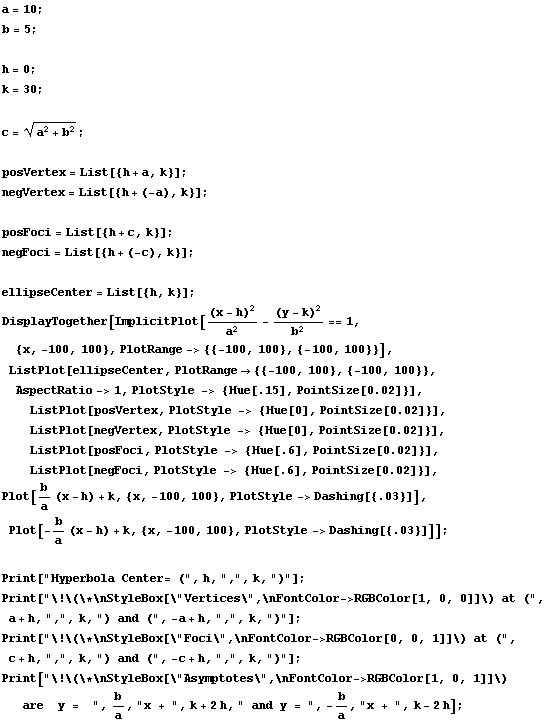
Graph: The following graph shows the hyperbolic pattern of the lighthouse beam. Note that  . This places the light of the lighthouse 30 feet above the ground.
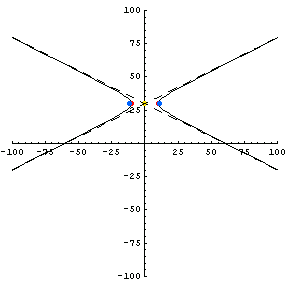


Conclusion: The light beam from the lighthouse would hit the surface of the water approximately 60 feet from the lighthouse.