
Linear Functions 1.2: Forming Lines
Student Name:

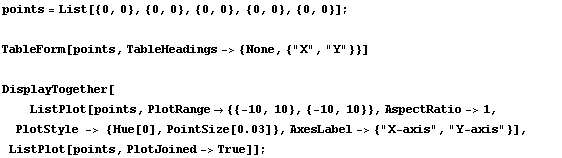
Plotting Points that Form a Line
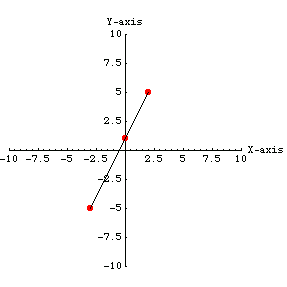
Lines on a graph can be represented by an equation such as  . In this equation, for every value of x there will be one value of y. Three points from
  are listed below.


Problem 1: Add three more points to the graph above. (To add points simply add to the points list above.)
Practice Problems
Problem 2: Graph 5 points on the line y = x + 1 . (To graph this equation, pick 5 values for x and calculate y, then enter those values in the points list below.)

Problem 3: Graph 5 points on the line y = x + 2. (To graph this equation pick 5 values for x and calculate y, then enter those values in the points list below.)
Problem 4: Graph 5 points on the line y = x + 3. (To graph this equation pick 5 values for x and calculate y, then enter those values in the points list below.)

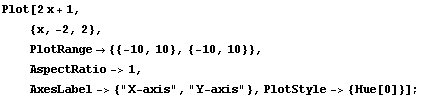
Plotting Equations with Mathematica
Mathematica will automatically calculate points that fit a linear equation.
When Mathematica graphs a line it generates all the possible points between two values for x. For example, in the following problem Mathematica is plotting all points between 2 and -2 in the equation  .
.

You can add labels to the graph, and make sure it is proportional by declaring the AspectRatio option. You can also control the limits (or ends) of the x-axis and y-axis by declaring the PlotRange option.
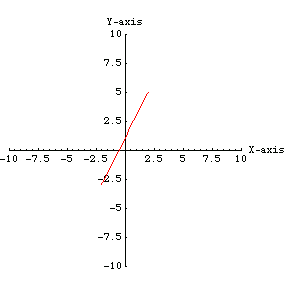
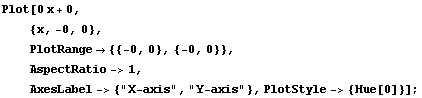
In the following example,  has been graphed again, but this new graph labels the x- and y-axes, and displays both axes from -10 to 10. It even shows the linear equation as a red line (PlotStyle->{Hue[0]}).
Problem 5: Change the following graph to display:
 the equation y = x - 3
the linear equation graphed from -5 to 5
the graph with axes from 15 to -15
Problem 6: Change the following graph to display:
the equation y =  x + 1
x + 1
the linear equation graphed from -5 to 5
the graph with axes from 15 to -15
