
Linear Functions 1.4: Lines of Best Fit
Student Name:

Generating a Line of Best Fit
It is very useful and interesting to be able to enter data for two variables, graph those points in a scatter plot, and then generate a line of best fit through those points. From the line of best fit, it is fairly simple to generate a linear equation. The linear equation can then be used to make predictions about observations that you might see in the data.
Graphing Data in a Scatter Plot
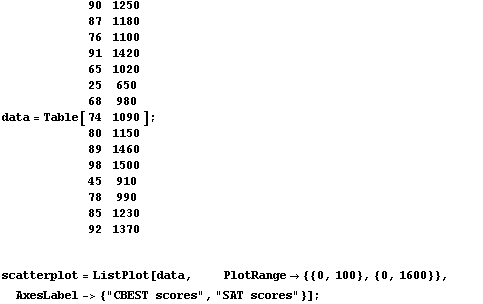
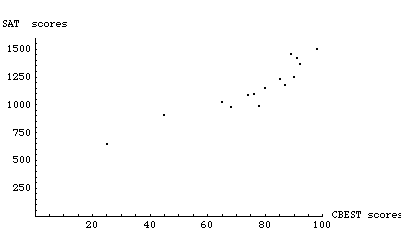
In the following example consisting of a table of  pairs, x represents the national percentile scores on the California Basic Educational Skills
  of 15 high school 11th graders. Those same students then completed the
  . Their SAT scores are represented by y. The graph below illustrates the relationship between the CBEST and the SAT scores.


Problem 1:
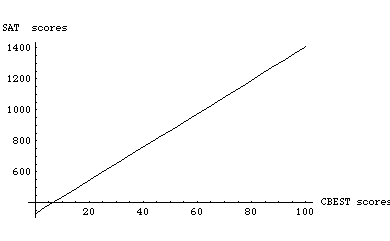
Notice that the Fit command generates an equation that has a slope and a y-intercept. Also notice that the equation does not have a y variable. The y is simply not printed. It is assumed that you know the y is really there! The real linear equations is:
y = 330.315 + 10.8008 x.
What is the slope of this linear equation?
What is the y-intercept of this linear equation?
Problem 1 Answers:
Slope =
y-intercept=
Now let us look at the line of best fit (also called the regression line), first without the original data and then with the original data showing on the graph.


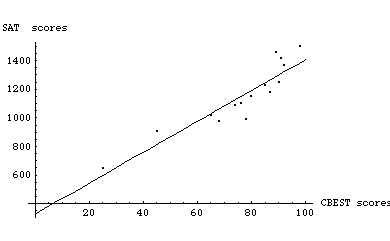

Notice that the line of best fit appears to run right through
the middle of all of the points. It "fits" all of the points.
Making Predictions from Your "Line of Best Fit"
Now that you know the equation of the line of best fit ( ), you can use this equation to make predictions about other points that have not actually been measured.
For example, you might ask, "If there was a student who scored in the 99th percentile on the CBEST, what score would you expect that student to get on the SAT?"
To make this prediction you would simply substitute the CBEST score of 99 for x in the linear equation.


So, you might expect a student in the 99th percentile to receive a SAT score of 1399.59 (or 1400). Keep in mind that this prediction is based only on the sample of students in your data set (15 students). This is not very many scores upon which to base your predictions. However, if you had 100, or 200, or even 10,000 scores, your line of best fit would become more and more accurate.
Problem 2:
Use this method of making predictions to answer the following questions:
a. If a student scored in the 65th percentile on the CBEST what SAT score would you predict for the student?
b. If a student scored in the 72nd percentile on the CBEST what SAT score would you predict for the student?
c. If a student scored in the 81st percentile on the CBEST what SAT score would you predict for the student?


Problem 2 Answers:
a. If a student scored in the 65th percentile on the CBEST, I would expect a SAT score of approximately:
b. If a student scored in the 72nd percentile on the CBEST, I would expect a SAT score of approximately:
c. If a student scored in the 81st percentile on the CBEST, I would expect a SAT score of approximately:
Practice Problems
Use the following weather data to complete the practice problems:

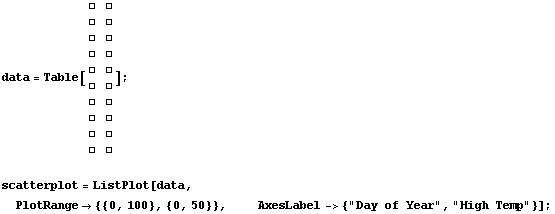
Problem 3: Create a graph comparing the Day of the Year (x) and the High Temperature (y). (In this problem all you really have to do is enter the correct data!) Describe your results in the answer space below.
Make sure to press 

 in the next input box to see your complete results.

Problem 3 Answers:
What is the slope of the line of best fit describing the relationship between the day of the year and the high temperature?
Slope =
What is the y-intercept of the line of best fit?
y-intercept =
Problem 4: Given the current data, what high temperature would you expect on the 120th day of the year?
Problem 4 Answer:
On the 120th day of the year the high temperature should be
Problem 5: Select one of the remaining variables (low temperature or precipitation) and analyze the relationship between the new variable and the day of the year. Make sure to graph the results and generate a line of best fit.
Problem 5 Answer:
Summarize your findings for Problem 5.