
Quadratic Functions 1.2
Student Name:
Properties of Simple Quadratic Functions
Each simple quadratic function  has 3 important properties that you will investigate in this lesson:
1. Does the graph point up or down?
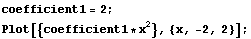
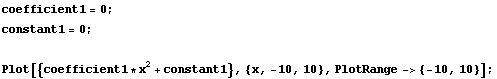
Each quadratic function generates a graph that points upward, toward the positive side of the y-axis, or downward, toward the negative side of the y-axis. The direction of the graph is determined by the sign (+ or -) on a, the coefficient of  .
.
 If the sign is positive, the graph will point upward (see the following graph).
If the sign is negative, the graph will point downward.
Problem 1: Change the coefficient in the previous problem so that the graph points downward.
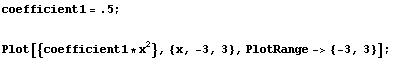
2. How narrow or wide is the graph?
The magnitude of the coefficient determines the width of a curve.
If the coefficient is small, the graph will wide (see the following graph).
If the coefficient is large, the graph will narrow.
Problem 2: Change the coefficient in the previous problem so that the curve is very narrow.
How large can you make the coefficient and still see the curve on the graph?
Which axis will the curve "disappear into" as the coefficient get very large?
How small can you make the coefficient and still see the curve on the graph?
Which axis will the curve "disappear into" as the coefficient get very small?
3. Where is the vertex of the graph on the y-axis?
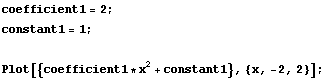
Most of the quadratic functions you have been graphing have a vertex at (0,0). However, the vertex can be at any point. The constant that is added to  will determine the y-coordinate of the vertex of your curve.
Notice in the following graph how the vertex is at (0,1).
Problem 3: Change the constant in the previous problem so that the graph has a vertex at (0, -3).
Practice Problems
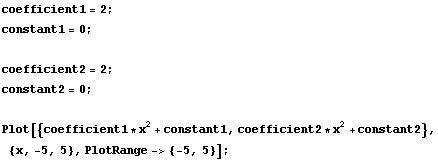
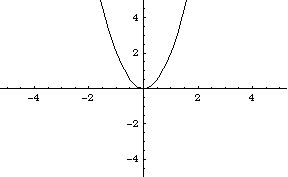
Problem 4: In the graph below change the constant of the second function so that the curve points downward with a vertex at (0, -2).
Problem 5: Find the quadratic function that generates the following graph.
Problem 5 Answer:
Problem 6: What is the pattern?
In the following graph, 6 functions have been drawn. Change the values of the coefficients and constants until you know the functions that generated this graph.
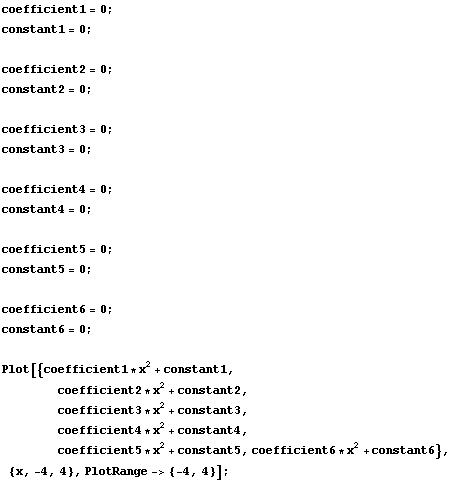
Problem 6 Answer:
What are the 6 functions used to generate the graph?
Describe the pattern you see forming between these functions.
Predict the next function that you would expect in this pattern.