The Wolfram Profiler allows you to run a computation and get a report that can help to improve its efficiency. The report tells how many times each subpart of the computation was executed and how long each of these took.
To carry out a profile, you should launch Mathematica in debug mode. You should set up your computation by preparing input and loading any initialization files that are necessary. Then you should execute your computation inside the command Profile. For example, the following will collect information on the execution of the function f, which is defined in the current project.
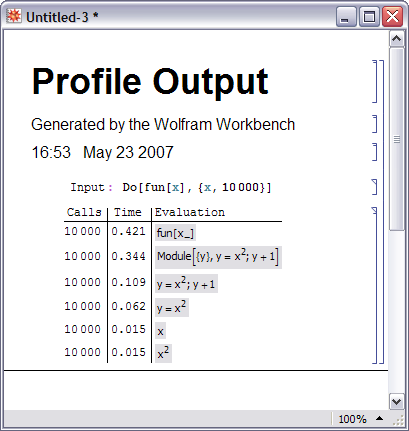
Profile[ Do[ fun[x],{x,10000}]]
An example of the profiler report is shown below.
The report shows the number of evaluations and the total time for each subexpression in the computation. The subexpressions themselves are linked to the source that they come from just as stack frames and breakpoints are linked. Thus, if you click the y+1 subexpression, it will link back to the source from which it was loaded.