The function NyquistArrayPlot allows you to investigate the frequency domain behavior of the elements of the inverse system, without actually computing the inverse. | NyquistArrayPlot[InverseSystem[system]] |
|
| | plot the Nyquist array for the inverse of the object system |
| NyquistArrayPlot[InverseSystem[system], {w, wmin, wmax}] |
|
|
| | generate the plot for frequency w running from wmin to wmax |
Creating the Nyquist array for inverse systems. Consider a linearized model of a water-cooled pressurized chemical reactor to be operated in a mode that is open-loop unstable. The system has two inputs, namely, the flow rate of material into the reactor and the flow rate of the water to the cooling jacket, and two outputs, namely, a temperature and the reactor vessel pressure. Make sure the application is loaded. This is a model of the reactor. | Out[3]= | 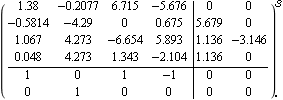 |
The system has two unstable poles at s = 1.99 and s = 0.063. | Out[5]= |  |
Here is the inverse-system Nyquist array of the system, for frequencies running from 0.01 to 10 rad/s. 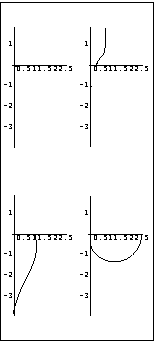
This system is neither row nor column diagonal dominant, due to the small size of element {1, 1} of the inverse-system Nyquist array. As the dominant elements are element {2, 1} and {1, 2}, the system might be more row diagonal dominant if row 1 and row 2 of the array are interchanged. Here is a simple inverse compensator to achieve the row interchange. | Out[8]= |  |
The negative element in the inverse compensator is used to reflect element {1, 1} of the resulting array about the real axis, from the point of the stability of loop 1. Basically, this means that positive feedback will be applied to loop 1. This connects the inverse compensator to the system. | Out[10]= | 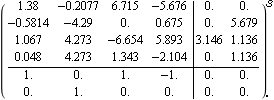 |
Here is the resulting inverse-system Nyquist array of the reactor, with Gershgorin row dominance circles. 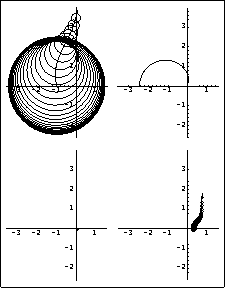
While row 2 is now nicely row diagonal dominant, row 1 is not. However, as indicated by the dominance circles on element {1, 1} of the array, the system will be closed-loop diagonal dominant and stable for gains in loop 1 greater than 3.5, as this will put the critical point for this loop to the left of -3.5. Recall that the open-loop system is unstable, and trying to make the inverse-system Nyquist array for the open-loop system diagonal dominant would probably require a complex dynamical multivariable compensator. The effect of closing the feedback loops with specific loop gains can be determined by generating the resulting Ostrowski circles using the option OstrowskiCircleLoopGains where, to achieve closed-loop diagonal dominance, the feedback loop gains fi must be chosen such that the resulting critical points {-fi, 0} are not enclosed by the Gershgorin circles. The spacing between the Ostrowski circles is the same as that used for the Gershgorin circles (see Section 5.2.1). However, you can independently specify the style of the Ostrowski circles using the option CircleStyle. CircleStyle takes the standard directives, such as Dashing, Hue, and Thickness, or the Automatic value. | option name | default value | | | OstrowskiCircleLoopGains
CircleStyle | None
Automatic | a list of loop gains to calculate the Ostrowski circles for the inverse-system Nyquist array plot
styles for the Ostrowski circles |
Option specific to the Nyquist array plot for inverse systems. Here is the inverse-system Nyquist array with Ostrowski circles for additional loop gains of 5 in loop 1 and 2 in loop 2. 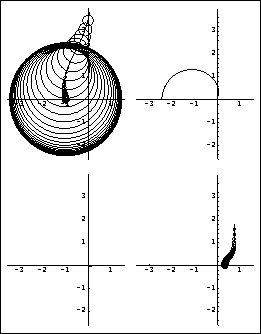
The resulting Ostrowski circles are very small and predict that there will be little interaction in the system when the feedback loops are closed with this compensator, with simple proportional-integral (PI) action controllers introduced in each control loop and unity feedback. Here are two single-loop PI compensators. | Out[14]= |  |
This is the resulting forward-path system. | Out[16]= | 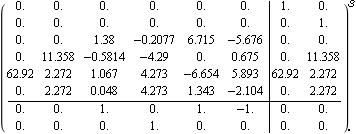 |
The closed-loop system is stable, with a pair of well-damped dominant poles. | Out[18]= | 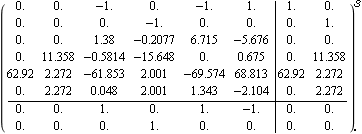 |
| Out[20]= |  |
The step responses of the resulting closed-loop system show an acceptable degree of interaction. 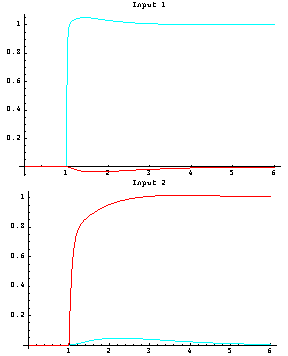
|