Documentation CalculationCenterFunctionsGraphics

|
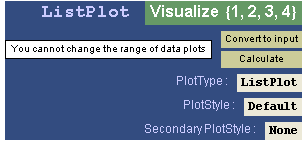
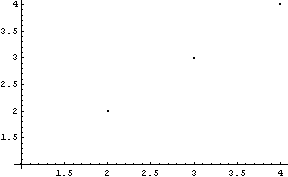
SmartPlot
 SmartPlot[f] or SmartPlot[f[vars]] gives an InstantCalculator to plot the function given. A default style and range for the plot is chosen automatically. SmartPlot[f] or SmartPlot[f[vars]] gives an InstantCalculator to plot the function given. A default style and range for the plot is chosen automatically.
You can also select the function you want plotted and click SmartPlot on the Home Controller.
You can use the buttons on the InstantCalculator to change the style or range of the plot. Click Calculate to redraw the plot.
See also: Plot, Plot3D, ListPlot, ListPlot3D.
Or see: 2D Plots, 3D Plots, Data Plots in Other Information.

Examples
In[3]:=

In[4]:=
|
