

PredictorMeasurements
PredictorMeasurements[predictor,testset,prop]
gives measurements associated with the property prop when predictor is evaluated on testset.
PredictorMeasurements[predictor,testset]
yields a measurement report that can be applied to any property.
PredictorMeasurements[data,…]
use predictions data instead of a predictor.
PredictorMeasurements[…,{prop1,prop2,…}]
gives properties prop1, prop2, etc.
Details and Options
- Measurements are used to determine the performance of a predictor on data that was not used for training purposes (the test set).
- Possible measurements include classification metrics (accuracy, likelihood, etc.), visualizations (confusion matrix, ROC curve, etc.) or specific examples (such as the worst classified examples).
- The predictor is typically a PredictorFunction object as generated by Predict.
- In PredictorMeasurements[data,…], the predictions data can have the following forms:
-
{y1,y2,…} predictions from a predictor (human, algorithm, etc.) {dist1,dist2,…} predictive distributions obtained by a predictor - PredictorMeasurements[…,opts] specifies that the predictor should use the options opts when applied to the test set. Possible options are as given in PredictorFunction.
- PredictorMeasurements[predictor,testset] returns a PredictorMeasurementsObject[…] that displays as a report panel, such as:
- PredictorMeasurementsObject[…][prop] can be used to look up prop from a PredictorMeasurementsObject. When repeated property lookups are required, this is typically more efficient than using PredictorMeasurements every time.
- PredictorMeasurementsObject[…][prop,opts] specifies that the predictor should use the options opts when applied to the test set. These options supersede original options given to PredictorMeasurements.
- PredictorMeasurements has the same options as PredictorFunction[…], with the following additions:
-
Weights Automatic weights to be associated with test set examples ComputeUncertainty False whether measures should be given with their statistical uncertainty - When ComputeUncertaintyTrue, numerical measures will be returned as Around[result,err], where err represents the standard error (corresponding to a 68% confidence interval) associated with measure result.
- Possible settings for Weights include:
-
Automatic associates weight 1 with all test examples {w1,w2,…} associates weight wi with the i ") test examples
test examples - Changing the weight of a test example from 1 to 2 is equivalent to duplicating the example.
- Weights affect measures as well as their uncertainties.
- Properties returning a single numeric value related to prediction abilities on the test set include:
-
"StandardDeviation" root mean square of the residuals "StandardDeviationBaseline" standard deviation of test set values "LogLikelihood" log-likelihood of the model given the test data "MeanCrossEntropy" mean cross entropy over test examples "MeanDeviation" mean absolute value of the residuals "MeanSquare" mean square of the residuals "RSquared" coefficient of determination "FractionVarianceUnexplained" fraction of variance unexplained "Perplexity" exponential of the mean cross entropy "RejectionRate" fraction of examples predicted as Indeterminate "GeometricMeanProbabilityDensity" geometric mean of the actual-class probability densities - Test examples classified as Indeterminate will be discarded when measuring properties related to prediction abilities on the test set, such as "StandardDeviation" or "MeanCrossEntropy".
- Properties returning graphics include:
-
"ComparisonPlot" plot of predicted values versus test values "ICEPlots" Individual Conditional Expectation (ICE) plots "ProbabilityDensityHistogram" histogram of actual-class probability densities "Report" panel reporting main measurements "ResidualHistogram" histogram of residuals "ResidualPlot" plot of the residuals "SHAPPlots" Shapley additive feature explanations plot for each class - Timing-related properties include:
-
"EvaluationTime" time needed to predict one example of the test set "BatchEvaluationTime" marginal time to predict one example in a batch - Properties returning one value for each test-set example include:
-
"Residuals" list of differences between predicted and test values "ProbabilityDensities" actual-class prediction probability densities "SHAPValues" Shapley additive feature explanations for each example - "SHAPValues" assesses the contribution of features by comparing predictions with different sets of features removed and then synthesized. The option MissingValueSynthesis can be used to specify how the missing features are synthesized. SHAP explanations are given as deviation from the training output mean. "SHAPValues"n can be used to control the number of samples used for the numeric estimations of SHAP explanations.
- Properties returning examples from the test set include:
-
"BestPredictedExamples" examples having the highest actual-class probability density "Examples" all test examples "Examples"{i1,i2} all examples in the interval i1 predicted in the interval i2 "LeastCertainExamples" examples having the highest distribution entropy "MostCertainExamples" examples having the lowest distribution entropy "WorstPredictedExamples" examples having the lowest actual-class probability density - Examples are given in the form inputivaluei, where valuei is the actual value.
- Properties such as "WorstPredictedExamples" or "MostCertainExamples" output up to 10 examples. PredictorMeasurementsObject[…][propn] can be used to output n examples.
- Other properties include:
-
"PredictorFunction" PredictorFunction[…] being measured "Properties" list of measurement properties available
Examples
open all close allBasic Examples (3)
Train a predictor on a training set:
p = Predict[{1 -> 2, 3 -> 4.5, 5 -> 6, 7 -> 8.5}]testset = {1.5 -> 2, 4 -> 5, 6 -> 5.5};Measure the standard deviation of the predictor on the test set:
PredictorMeasurements[p, testset, "StandardDeviation"]PredictorMeasurements[p, testset, "ResidualPlot"]Visualize a scatter plot of the actual and predicted values:
PredictorMeasurements[p, testset, "ComparisonPlot"]Measure several properties at once:
PredictorMeasurements[p, testset, {"StandardDeviation", "RSquared", "MeanCrossEntropy"}]Train a predictor on a training set:
p = Predict[{1 -> 2, 3 -> 4.5, 5 -> 6, 7 -> 8.5}]Generate a measurement object of the predictor on the test set:
pm = PredictorMeasurements[p, {1.5 -> 2, 4 -> 5, 6 -> 5.5}]Obtain the list of measurement properties available:
pm["Properties"]Measure the standard deviation of the predictor on the test set:
pm["StandardDeviation"]Obtain the standard deviation along with its statistical uncertainty due to finite test-set size:
pm["StandardDeviation", ComputeUncertainty -> True]pm[{"StandardDeviation", "RSquared"}, ComputeUncertainty -> True]Measure the standard deviation directly from classified examples:
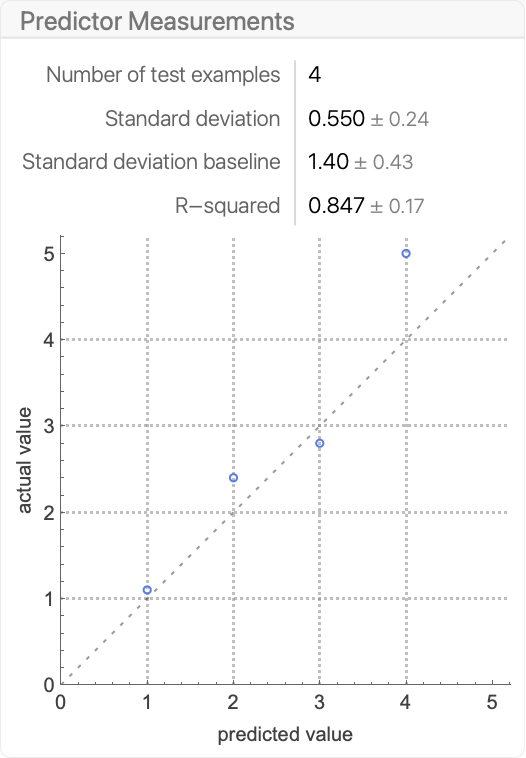
PredictorMeasurements[{1, 2, 3, 4}, {1.1, 2.4, 2.8, 5}, "StandardDeviation"]PredictorMeasurements[{1, 2, 3, 4}, {1.1, 2.4, 2.8, 5}]Measure the log-likelihood from predictive distributions:
PredictorMeasurements[{NormalDistribution[1, 1.2], NormalDistribution[2, 0.8], NormalDistribution[3, 1.9], NormalDistribution[4, 2.1]}, {1.1, 2.4, 2.8, 5}, "LogLikelihood"]Scope (3)
Residual-Based Metrics (1)
Visualize the residuals of predicted examples against their true values:
PredictorMeasurements[{1, 2, 3, 4}, {1.1, 2.4, 2.8, 5}, "ResidualPlot"]Measure the standard deviation:
PredictorMeasurements[{1, 2, 3, 4}, {1.1, 2.4, 2.8, 5}, "StandardDeviation"]This is equivalent to computing the root mean square of the residuals:
Sqrt@Mean[PredictorMeasurements[{1, 2, 3, 4}, {1.1, 2.4, 2.8, 5}, "Residuals"] ^ 2]Obtain the statistical uncertainty on this measure:
PredictorMeasurements[{1, 2, 3, 4}, {1.1, 2.4, 2.8, 5}, "StandardDeviation", ComputeUncertainty -> True]Compare the standard deviation to a baseline (always predicting the mean of the test-set values):
PredictorMeasurements[{1, 2, 3, 4}, {1.1, 2.4, 2.8, 5}, "StandardDeviationBaseline", ComputeUncertainty -> True]PredictorMeasurements[{1, 2, 3, 4}, {1.1, 2.4, 2.8, 5}, "RSquared"]This is equivalent to the proportion of variance that is explained:
1 - PredictorMeasurements[{1, 2, 3, 4}, {1.1, 2.4, 2.8, 5}, "StandardDeviation"] ^ 2 / PredictorMeasurements[{1, 2, 3, 4}, {1.1, 2.4, 2.8, 5}, "StandardDeviationBaseline"] ^ 2Measure the fraction of variance unexplained:
PredictorMeasurements[{1, 2, 3, 4}, {1.1, 2.4, 2.8, 5}, "FractionVarianceUnexplained"]PredictorMeasurements[{1, 2, 3, 4}, {1.1, 2.4, 2.8, 5}, "RSquared"] + PredictorMeasurements[{1, 2, 3, 4}, {1.1, 2.4, 2.8, 5}, "FractionVarianceUnexplained"]Comparison Plot and Example Extraction (1)
Create a training set and a test set on the Boston homes data:
{training, test} = TakeDrop[RandomSample@ResourceData["Sample Data: Boston Homes"], 300];Dataset[training, MaxItems -> 5]Train a model on the training set:
p = Predict[training -> "MEDV"]Create a classifier measurements object for this classifier on the test set:
pm = PredictorMeasurements[p, test]Find the two test examples that have the worst predictions:
pm["WorstPredictedExamples" -> 2]#1 -> p[#1]&@@@pm["WorstPredictedExamples" -> 2]Find the two test examples that have the best predictions:
pm["BestPredictedExamples" -> 2]#1 -> p[#1]&@@@pm["BestPredictedExamples" -> 2]Compare the predicted and correct values:
pm["ComparisonPlot"]Extract the examples whose true values are between 30 and 40 and whose predictions are between 40 and 50:
pm["Examples" -> {{30, 40}, {40, 50}}]Probabilistic Metrics (1)
Create and visualize an artificial dataset from the expression Cos[x*y]:
Plot3D[Cos[x * y], {x, -2, 2}, {y, -2, 2}]points = {##, Cos[#1 * #2] + RandomReal[{-.2, .2}]}&@@@RandomReal[{-2, 2}, {1000, 2}];ListPointPlot3D[points]Split the dataset into a training set and a test set:
{trainingset, testset} = TakeDrop[{#1, #2} -> #3&@@@points, 800];Train a predictor on the training set:
p = Predict[trainingset]Measure the log-likelihood of the test set (total log-PDF of actual value):
PredictorMeasurements[p, testset, "LogLikelihood"]Measure the mean cross-entropy:
PredictorMeasurements[p, testset, "MeanCrossEntropy"]The mean cross-entropy is the average negative log-likelihood:
-PredictorMeasurements[p, testset, "LogLikelihood"] / Length[testset]Options (5)
IndeterminateThreshold (1)
Create an artificial dataset and visualize it:
points = {#, Cos[#] + RandomReal[#]}& /@ RandomReal[{-3, 3}, {1000}];
dataset = Rule @@@ points;ListPlot[points]Split the dataset into a training set and a test set:
trainingset = dataset[[ ;; 800]];
testset = dataset[[801 ;; ]];
Train a predictor on the training set:
p = Predict[trainingset]Plot the predicted distribution for a few feature values:
Plot[{
	PDF[p[-2, "Distribution"], y],
	PDF[p[-1, "Distribution"], y],
	PDF[p[0., "Distribution"], y]
	}, {y, -3, 2}, PlotRange -> All, PlotLegends -> "Expressions"]
Compute the root mean square of the residuals:
PredictorMeasurements[p, testset, "StandardDeviation"]Perform the same computation with a different threshold value for the predictor:
PredictorMeasurements[p, testset, "StandardDeviation", IndeterminateThreshold -> 1]This operation can also be done on the PredictorMeasurementsObject:
pm = PredictorMeasurements[p, testset]pm["StandardDeviation", IndeterminateThreshold -> 1]Plot the standard deviation and the rejection rate as a function of the threshold:
Get["MachineLearning`"]
DiscretePlot[pm["StandardDeviation", IndeterminateThreshold -> x], {x, 0, 5, .5}, Joined -> True]DiscretePlot[pm["RejectionRate", IndeterminateThreshold -> x], {x, 0, 5, .5}, Joined -> True]TargetDevice (1)
Train a predictor using a neural network:
trainingData = RandomReal[1, {2000, 4}] -> RandomReal[1, 2000];
predictor = Predict[trainingData, Method -> "NeuralNetwork"]
Measure the standard deviation of the predictor on a test set for different setting of TargetDevice:
testset = RandomReal[1, {10, 4}] -> RandomReal[1, 10];AbsoluteTiming[PredictorMeasurements[predictor, testset, "StandardDeviation", TargetDevice -> "GPU"]]AbsoluteTiming[PredictorMeasurements[predictor, testset, "StandardDeviation", TargetDevice -> "CPU"]]UtilityFunction (1)
Define a training and a test set:
trainingset = {1 -> 1.1, 2 -> 4.4, 3 -> 6.1, 4 -> 7.1, 5 -> 9.2};testset = {0.7 -> 1.3, 2.1 -> 4.7, 3.5 -> 5.8, 3.5 -> 6.6};Train a predictor on the training set:
p = Predict[trainingset]Define and visualize a utility function that penalizes the predicted value's being smaller than the actual value:
utility[a_, p_] := -Piecewise[{{Exp[p - a], a < p}, {Exp[3 * (a - p)], a ≥ p}}]Plot[utility[0, p], {p, -1, 2}]Compute the residuals of the predictor on the test set with this utility function:
PredictorMeasurements[p, testset, "Residuals", UtilityFunction -> utility]The residuals with the default utility function are higher:
PredictorMeasurements[p, testset, "Residuals"]The utility function can also be specified when using the PredictorMeasurementsObject:
pm = PredictorMeasurements[p, testset]pm["Residuals", UtilityFunction -> utility]"Uncertainty" (1)
Train a predictor on the "WineQuality" dataset:
training = ExampleData[{"MachineLearning", "WineQuality"}, "TrainingData"];p = Predict[training]Generate a PredictorMeasurements[…] object using a test set:
test = ExampleData[{"MachineLearning", "WineQuality"}, "TestData"];pm = PredictorMeasurements[p, test]Obtain a measure of the standard deviation along with its uncertainty:
pm["StandardDeviation", ComputeUncertainty -> True]Obtain a measure of other properties along with their uncertainties:
Dataset[AssociationMap[pm[#, ComputeUncertainty -> True]&, {"GeometricMeanProbabilityDensity", "MeanCrossEntropy", "MeanDeviation", "MeanSquare", "TotalSquare"}]]Weights (1)
Create a predictor on a training set:
p = Predict[{1 -> 2, 3 -> 4.5, 5 -> 6, 7 -> 8.5}]Generate a measurement object while specifying the weights that each test example has:
pm = PredictorMeasurements[p, {1.5 -> 2, 4 -> 5, 6 -> 5.5, 3 -> 5}, Weights -> {1.5, 3, 2, 1}]Compute the standard deviation:
pm["StandardDeviation"]Weights can also be modified when using the measurement object:
pm["StandardDeviation", Weights -> {1, 1, 1, 3}]Uncertainties are also affected by weights:
pm["StandardDeviation", ComputeUncertainty -> True]pm["StandardDeviation", Weights -> {1, 1, 1, 3}, ComputeUncertainty -> True]Applications (2)
Load a dataset of the average monthly temperature as a function of the city, the year and the month:
dataset = RandomSample[{#2, #3, #4} -> #1& @@@ExampleData[{"Statistics", "USCityTemperature"}]];RandomSample[dataset, 3] // TableFormSplit the dataset into a training set and a test set:
trainingset = dataset[[ ;; 200]];testset = dataset[[201 ;; ]];Train a predictor on the training set:
p = Predict[trainingset]Generate a PredictorMeasurementsObject from the predictor and the test set:
pm = PredictorMeasurements[p, testset]Compute the mean cross entropy of the classifier on the test set:
pm["MeanCrossEntropy"]Visualize the scatter plot of the test values as a function of the predicted values:
pm["ComparisonPlot"]Extract the test examples that are in a given region of the comparison plot:
pm["Examples" -> {{30, 40}, {40, 60}}]Extract the 20 worst predicted examples:
pm["WorstPredictedExamples" -> 20]Train a predictor that predicts the median value of properties in a neighborhood of Boston, given some features of the neighborhood:
p = Predict[ExampleData[{"MachineLearning", "BostonHomes"}, "TrainingData"], PerformanceGoal -> "Quality"]Generate a predictor measurements object to analyze the performance of the predictor on a test set:
pm = PredictorMeasurements[p, ExampleData[{"MachineLearning", "BostonHomes"}, "TestData"]]pm["ResidualPlot"]Plot a histogram of the residuals:
pm["ResidualHistogram"]Compute the standard deviation of the predicted values from the actual values (root mean square of the residuals):
pm["StandardDeviation"]Obtain the statistical uncertainty of the above measure:
pm["StandardDeviation", ComputeUncertainty -> True]Text
Wolfram Research (2014), PredictorMeasurements, Wolfram Language function, https://reference.wolfram.com/language/ref/PredictorMeasurements.html (updated 2021).
CMS
Wolfram Language. 2014. "PredictorMeasurements." Wolfram Language & System Documentation Center. Wolfram Research. Last Modified 2021. https://reference.wolfram.com/language/ref/PredictorMeasurements.html.
APA
Wolfram Language. (2014). PredictorMeasurements. Wolfram Language & System Documentation Center. Retrieved from https://reference.wolfram.com/language/ref/PredictorMeasurements.html