SpatialGraphDistribution
represents a spatial distribution for graphs with n vertices uniformly distributed over the unit square and edges between vertices that are at distance at most r.
SpatialGraphDistribution[n,r,d]
represents a spatial distribution for graphs with vertices uniformly distributed over the d-dimensional unit square.
SpatialGraphDistribution[n,r,dist]
represents a spatial distribution for graphs with vertices distributed according to the probability distribution dist.
SpatialGraphDistribution[n,r,reg]
represents a spatial distribution for graphs with vertices uniformly distributed in the region reg.
Details and Options
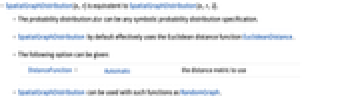
- SpatialGraphDistribution[n,r] is equivalent to SpatialGraphDistribution[n,r,2].
- The probability distribution dist can be any symbolic probability distribution specification.
- SpatialGraphDistribution by default effectively uses the Euclidean distance function EuclideanDistance.
- The following option can be given:
-
DistanceFunction Automatic the distance metric to use - SpatialGraphDistribution can be used with such functions as RandomGraph.
Examples
open allclose allBasic Examples (2)
Scope (7)
Generate simple undirected graphs:
Generate graphs with vertices uniformly distributed in unit cubes of different dimensions:
Generate graphs with vertices distributed according to different distributions:
Generate graphs with vertices uniformly distributed over a geometric region:
Generate graphs with distance measured using different norms:
Options (2)
DistanceFunction (2)
By default, distance is measured using EuclideanDistance:
Applications (3)
A wireless ad hoc network can be modeled with a SpatialGraphDistribution:
Nodes are connected if they are sufficiently near each other:
In a piece of brain cortex with 100 neurons, the neurons are connected by synapses if they are at a distance less than 0.2:
Find the probability that the network is connected:
A frog in a lily pond is able to jump 1.5 feet to get from one of the 25 lily pads to another. Model the frog jumping network from the lily pad density and SpatialGraphDistribution:
Find the largest collection of lily pads the frog can jump between:
Use simulation to find the sizes of the largest collections of lily pads for similar ponds:
Find the number of times the frog would have to swim to visit all lily pads:
Properties & Relations (6)
Distribution of the number of vertices:
Distribution of the number of edges:
Use UniformDistribution and EuclideanDistance to simulate SpatialGraphDistribution:
Text
Wolfram Research (2012), SpatialGraphDistribution, Wolfram Language function, https://reference.wolfram.com/language/ref/SpatialGraphDistribution.html (updated 2022).
CMS
Wolfram Language. 2012. "SpatialGraphDistribution." Wolfram Language & System Documentation Center. Wolfram Research. Last Modified 2022. https://reference.wolfram.com/language/ref/SpatialGraphDistribution.html.
APA
Wolfram Language. (2012). SpatialGraphDistribution. Wolfram Language & System Documentation Center. Retrieved from https://reference.wolfram.com/language/ref/SpatialGraphDistribution.html