Search for all pages containing EquationTrekker
EquationTrekker[eqn,x,{t,tmin,tmax}]
opens a graphical interface for specifying initial conditions and plotting the resulting numerical solution to the first- or second-order ordinary differential equation eqn for the function x with the independent variable t in the range tmin to tmax.
EquationTrekker[eqns,{x,y},{t,tmin,tmax}]
opens a graphical interface for specifying initial conditions and plotting the resulting numerical solution to the system of two first-order ordinary differential equations eqns for the functions x and y.
EquationTrekker[state]
reopens a graphical interface with the treks saved in the EquationTrekkerState object state.


EquationTrekker
EquationTrekker[eqn,x,{t,tmin,tmax}]
opens a graphical interface for specifying initial conditions and plotting the resulting numerical solution to the first- or second-order ordinary differential equation eqn for the function x with the independent variable t in the range tmin to tmax.
EquationTrekker[eqns,{x,y},{t,tmin,tmax}]
opens a graphical interface for specifying initial conditions and plotting the resulting numerical solution to the system of two first-order ordinary differential equations eqns for the functions x and y.
EquationTrekker[state]
reopens a graphical interface with the treks saved in the EquationTrekkerState object state.
Details and Options
- To use EquationTrekker, you first need to load the Equation Trekker Package using Needs["EquationTrekker`"].
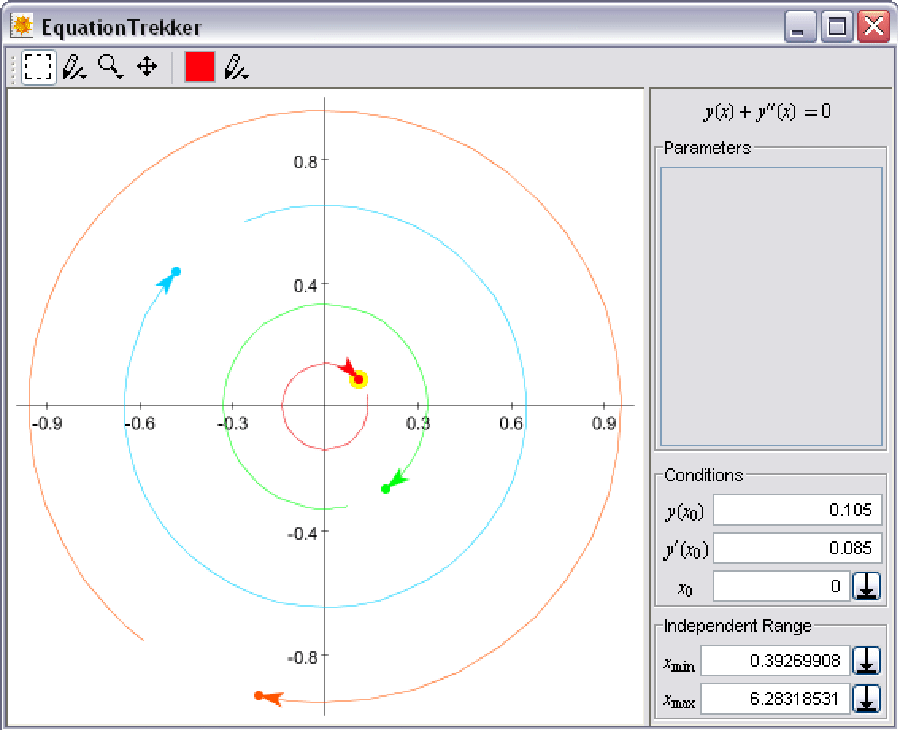
- If eqn is a single first-order ODE, plots of x[t] versus t are displayed. If eqn is a single second-order ODE, plots of x'[t] versus x[t] are displayed. If eqns consist of a system of two first-order ODEs, plots of y[t] versus x[t] are displayed.
- Treks are invoked by right-clicking a coordinate, which generates a trek that starts at the point specified by the mouse cursor.
- The initial position of a trek is highlighted in yellow, and by default corresponds to an initial condition specified at t=0. However, only the section of the trek from tmin to tmax is displayed, with the coordinate associated with tmin displayed as a point and the coordinate associated with tmax displayed as an arrowhead.
- Changing defaults for newly created treks may be accomplished by typing a value in the text field and clicking the
![_(GraphicsData[CompressedBitmap, eJx1k81rE1EUxU8+Rl10Kbjtxv/CtYrQpeA2FGmL37W7UleCgi4EUXBXLIIo]
CILUVangQqgfRWyrtk2aTJppMpNMZibJZDpNE899M9FW4+LeOfPe+d135715
I5mp8YtXMlMTo5nhM5OZ6+MTozeHT1+b5FAqAeC4xDBE9yj76Qhq5jrqtS00
3B34rRrafh2B76QRtJ0UwtBPiYJkD7uBx6eLBJEcC6RhGiuoVn5g5slLnLxw
ewg4NUXziZFbuHz/GVpNi+a2bytzqbCMsTuzOHfjIeZevRmSHmh+/XYeZ68+
wKV7czQLIuZi7pMqs/hhCfrWWt+88f0z5hcW1FSCXRtqtJj7qFauWgaSsKwS
C1SZ5T2OZMTLm6YclXIB2/o68tkVxSbg2vqhao5j0es4ZjpiqVi3bpdhKvan
uBJw7ELccYS5blVC/NYRIZOqEsl6BZZZREnf6JP5Q6Tn1SSSgh9TH6ypaoJX
rW0Yxc241X9JW0LsNfWlaVHMjlNVO2EUs4PXbDbrEhoaDTsmqZilGbtmoFzK
DSZbLVdCI+7EJJXi62qXKkZ+MOn7DQmNyYtJKmYp6XKXLe7vf8imhJCN32RD
kR5Ji6R+kPxzmEHQ5u8eBH6MUTG32y3+RDavgTEYC8OQWBjuxhiVygF/VI9u
8yCmQc9G2P5+R0Wn06G909lLRqdJxeJ7eyF84tFZyvXrL8k7hMUvm1yy2+3G
DBVnu919zmwoR0Jd2/6+TD96jvMzT/FuOauh1+vFGBWx1a2ympx+/IKYubMa
3cT8Mgz9q0L/urZjd2dR3v5Gs2TpSyAB5NuOorC5lEJ27X1KFGdlVLoQR3+B
xC8wePil) _(GraphicsData[CompressedBitmap, eJx1k81rE1EUxU8+Rl10Kbjtxv/CtYrQpeA2FGmL37W7UleCgi4EUXBXLIIo]
CILUVangQqgfRWyrtk2aTJppMpNMZibJZDpNE899M9FW4+LeOfPe+d135715
I5mp8YtXMlMTo5nhM5OZ6+MTozeHT1+b5FAqAeC4xDBE9yj76Qhq5jrqtS00
3B34rRrafh2B76QRtJ0UwtBPiYJkD7uBx6eLBJEcC6RhGiuoVn5g5slLnLxw
ewg4NUXziZFbuHz/GVpNi+a2bytzqbCMsTuzOHfjIeZevRmSHmh+/XYeZ68+
wKV7czQLIuZi7pMqs/hhCfrWWt+88f0z5hcW1FSCXRtqtJj7qFauWgaSsKwS
C1SZ5T2OZMTLm6YclXIB2/o68tkVxSbg2vqhao5j0es4ZjpiqVi3bpdhKvan
uBJw7ELccYS5blVC/NYRIZOqEsl6BZZZREnf6JP5Q6Tn1SSSgh9TH6ypaoJX
rW0Yxc241X9JW0LsNfWlaVHMjlNVO2EUs4PXbDbrEhoaDTsmqZilGbtmoFzK
DSZbLVdCI+7EJJXi62qXKkZ+MOn7DQmNyYtJKmYp6XKXLe7vf8imhJCN32RD
kR5Ji6R+kPxzmEHQ5u8eBH6MUTG32y3+RDavgTEYC8OQWBjuxhiVygF/VI9u
8yCmQc9G2P5+R0Wn06G909lLRqdJxeJ7eyF84tFZyvXrL8k7hMUvm1yy2+3G
DBVnu919zmwoR0Jd2/6+TD96jvMzT/FuOauh1+vFGBWx1a2ympx+/IKYubMa
3cT8Mgz9q0L/urZjd2dR3v5Gs2TpSyAB5NuOorC5lEJ27X1KFGdlVLoQR3+B
xC8wePil)](Files/EquationTrekker.en/1.png) button.
button. - EquationTrekker generates a modal dialog, and the kernel is controlled by the graphical interface until the window is closed.
- When the window is closed, a list containing an EquationTrekkerState object and a graphic is returned. The EquationTrekkerState object contains all of the information necessary to reopen the window with the treks that were displayed when the window was closed.
- The following options can be given:
-
ImageSize {400,400} absolute size of EquationTrekker window PlotRange {Automatic,{-1,1}} range of values to include TrekParameters {} list of parameters and parameter ranges TrekGenerator DifferentialEquationTrek method used to generate treks - A valid setting for TrekParameters is a list of rules of the form param->range, where range consists of a starting value and a range, {v,{vmin,vmax}}. The range specification may also consist of a single value v, which is equivalent to {v,{0,2v}}.
- Valid settings for TrekGenerator are DifferentialEquationTrek and PoincareSection.
- The default setting TrekGenerator->DifferentialEquationTrek creates treks by following the path of the dependent variables generated using NDSolve.
- The setting TrekGenerator->PoincareSection creates treks by sampling the phase space. The sampling interval is typically periodic.
- The setting TrekGenerator->{method,subopts} may be used to include the suboptions subopts for the TrekGenerator method method.
Examples
open all close allBasic Examples (1)
This is a simple example demonstrating how EquationTrekker operates:
A window similar to the one below will appear (but with an empty canvas). Click the canvas to add treks:

