ContourStyle
is an option for contour plots that specifies the style in which contour lines or surfaces should be drawn.
Details
- ContourStyle->g specifies that a graphics directive g should be used to draw all contour lines or surfaces.
- ContourStyle->{g1,g2,…} specifies that successive directives gi should be used to draw successive contours.
- If equations are given as input to ContourPlot or ContourPlot3D, the successive directives in ContourStyle->{g1,g2,…} are used cyclically to draw contours for the successive equations.
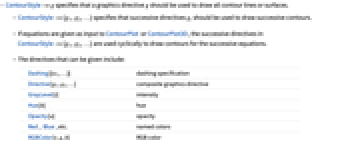
- The directives that can be given include:
-
Dashing[{w1,…}] dashing specification Directive[g1,g2,…] composite graphics directive GrayLevel[i] intensity Hue[h] hue Opacity[a] opacity Red, Blue, etc. named colors RGBColor[r,g,b] RGB color Thickness[w] line thickness - For individual gi, a list of directives is equivalent to Directive[…]. For a single g, a list of directives must be given as {list}.
- ContourStyle->None specifies that no explicit contour lines or surfaces should be drawn. Contour shading and meshes are not affected.
Examples
Wolfram Research (1991), ContourStyle, Wolfram Language function, https://reference.wolfram.com/language/ref/ContourStyle.html (updated 2007).
Text
Wolfram Research (1991), ContourStyle, Wolfram Language function, https://reference.wolfram.com/language/ref/ContourStyle.html (updated 2007).
CMS
Wolfram Language. 1991. "ContourStyle." Wolfram Language & System Documentation Center. Wolfram Research. Last Modified 2007. https://reference.wolfram.com/language/ref/ContourStyle.html.
APA
Wolfram Language. (1991). ContourStyle. Wolfram Language & System Documentation Center. Retrieved from https://reference.wolfram.com/language/ref/ContourStyle.html