


ContourPlot3D
ContourPlot3D[f,{x,xmin,xmax},{y,ymin,ymax},{z,zmin,zmax}]
produces a three-dimensional contour plot of f as a function of x, y, and z.
ContourPlot3D[f==g,{x,xmin,xmax},{y,ymin,ymax},{z,zmin,zmax}]
plots the contour surface for which ![]() .
.
ContourPlot3D[…,{x,y,z}∈reg]
takes the variables {x,y,z} to be in the geometric region reg.
Details and Options
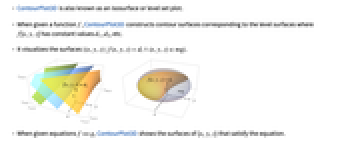
- ContourPlot3D is also known as an isosurface or level set plot.
- When given a function f, ContourPlot3D constructs contour surfaces corresponding to the level surfaces where f[x,y,z] has constant values d1, d2, etc.
- It visualizes the surfaces
 .
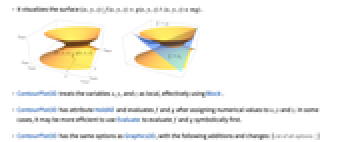
. - When given equations f==g, ContourPlot3D shows the surfaces of {x,y,z} that satisfy the equation.
- It visualizes the surface
 .
. - ContourPlot3D treats the variables x, y, and z as local, effectively using Block.
- ContourPlot3D has attribute HoldAll and evaluates f and g after assigning numerical values to x, y and z. In some cases, it may be more efficient to use Evaluate to evaluate f and g symbolically first.
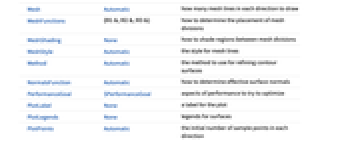
- ContourPlot3D has the same options as Graphics3D, with the following additions and changes: [List of all options]
-
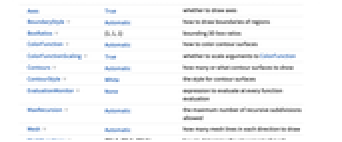
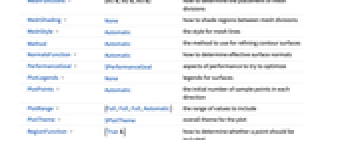
Axes True whether to draw axes BoundaryStyle Automatic how to draw boundaries of regions BoxRatios {1,1,1} bounding 3D box ratios ColorFunction Automatic how to color contour surfaces ColorFunctionScaling True whether to scale arguments to ColorFunction Contours Automatic how many or what contour surfaces to show ContourStyle White the style for contour surfaces EvaluationMonitor None expression to evaluate at every function evaluation MaxRecursion Automatic the maximum number of recursive subdivisions allowed Mesh Automatic how many mesh lines in each direction to draw MeshFunctions {#1&,#2&,#3&} how to determine the placement of mesh divisions MeshShading None how to shade regions between mesh divisions MeshStyle Automatic the style for mesh lines Method Automatic the method to use for refining contour surfaces NormalsFunction Automatic how to determine effective surface normals PerformanceGoal $PerformanceGoal aspects of performance to try to optimize PlotLegends None legends for surfaces PlotPoints Automatic the initial number of sample points in each direction PlotRange {Full,Full,Full,Automatic} the range of values to include PlotTheme $PlotTheme overall theme for the plot RegionFunction (True&) how to determine whether a point should be included RegionBoundaryStyle Automatic the style for region boundaries ScalingFunctions None how to scale individual coordinates TextureCoordinateFunction Automatic how to determine texture coordinates TextureCoordinateScaling True whether to scale arguments to TextureCoordinateFunction WorkingPrecision MachinePrecision the precision used in internal computations - ContourPlot3D initially evaluates f at a 3D grid of equally spaced sample points specified by PlotPoints. Then it uses an adaptive algorithm to subdivide at most MaxRecursion times to generate smooth contours.
- You should realize that since it uses only a finite number of sample points, it is possible for ContourPlot3D to miss features of your functions. To check your results, you should try increasing the settings for PlotPoints and MaxRecursion.
- The arguments supplied to functions in MeshFunctions and RegionFunction are x, y, z, f. Functions in ColorFunction and TextureCoordinateFunction are by default supplied with scaled versions of these arguments.
- Possible settings for ScalingFunctions include:
-
sf scale the fcontour values {sx,sy,sz} scale x, y and z axes {sx,sy,sz,sf} scale x, y and z axes and fcontour values - Common built-in scaling functions s include:
-
"Log" 
log scale with automatic tick labeling "Log10" 
base-10 log scale with powers of 10 for ticks "SignedLog" 
log-like scale that includes 0 and negative numbers "Reverse" 
reverse the coordinate direction "Infinite" 
infinite scale - ContourPlot3D returns Graphics3D[GraphicsComplex[data]].
- Themes that affect 3D surfaces include:
-
"DarkMesh" dark mesh lines 
"GrayMesh" gray mesh lines 
"LightMesh" light mesh lines 
"ZMesh" vertically distributed mesh lines 
"ThickSurface" add thickness to surfaces -
AlignmentPoint Center the default point in the graphic to align with AspectRatio Automatic ratio of height to width Axes True whether to draw axes AxesEdge Automatic on which edges to put axes AxesLabel None axes labels AxesOrigin Automatic where axes should cross AxesStyle {} graphics directives to specify the style for axes Background None background color for the plot BaselinePosition Automatic how to align with a surrounding text baseline BaseStyle {} base style specifications for the graphic BoundaryStyle Automatic how to draw boundaries of regions Boxed True whether to draw the bounding box BoxRatios {1,1,1} bounding 3D box ratios BoxStyle {} style specifications for the box ClipPlanes None clipping planes ClipPlanesStyle Automatic style specifications for clipping planes ColorFunction Automatic how to color contour surfaces ColorFunctionScaling True whether to scale arguments to ColorFunction ContentSelectable Automatic whether to allow contents to be selected Contours Automatic how many or what contour surfaces to show ContourStyle White the style for contour surfaces ControllerLinking False when to link to external rotation controllers ControllerPath Automatic what external controllers to try to use Epilog {} 2D graphics primitives to be rendered after the main plot EvaluationMonitor None expression to evaluate at every function evaluation FaceGrids None grid lines to draw on the bounding box FaceGridsStyle {} style specifications for face grids FormatType TraditionalForm default format type for text ImageMargins 0. the margins to leave around the graphic ImagePadding All what extra padding to allow for labels, etc. ImageSize Automatic absolute size at which to render the graphic LabelStyle {} style specifications for labels Lighting Automatic simulated light sources to use MaxRecursion Automatic the maximum number of recursive subdivisions allowed Mesh Automatic how many mesh lines in each direction to draw MeshFunctions {#1&,#2&,#3&} how to determine the placement of mesh divisions MeshShading None how to shade regions between mesh divisions MeshStyle Automatic the style for mesh lines Method Automatic the method to use for refining contour surfaces NormalsFunction Automatic how to determine effective surface normals PerformanceGoal $PerformanceGoal aspects of performance to try to optimize PlotLabel None a label for the plot PlotLegends None legends for surfaces PlotPoints Automatic the initial number of sample points in each direction PlotRange {Full,Full,Full,Automatic} the range of values to include PlotRangePadding Automatic how much to pad the range of values PlotRegion Automatic final display region to be filled PlotTheme $PlotTheme overall theme for the plot PreserveImageOptions Automatic whether to preserve image options when displaying new versions of the same graphic Prolog {} 2D graphics primitives to be rendered before the main plot RegionBoundaryStyle Automatic the style for region boundaries RegionFunction (True&) how to determine whether a point should be included RotationAction "Fit" how to render after interactive rotation ScalingFunctions None how to scale individual coordinates SphericalRegion Automatic whether to make the circumscribing sphere fit in the final display area TextureCoordinateFunction Automatic how to determine texture coordinates TextureCoordinateScaling True whether to scale arguments to TextureCoordinateFunction Ticks Automatic specification for ticks TicksStyle {} style specification for ticks TouchscreenAutoZoom False whether to zoom to fullscreen when activated on a touchscreen ViewAngle Automatic angle of the field of view ViewCenter Automatic point to display at the center ViewMatrix Automatic explicit transformation matrix ViewPoint {1.3,-2.4,2.} viewing position ViewProjection Automatic projection method for rendering objects distant from the viewer ViewRange All range of viewing distances to include ViewVector Automatic position and direction of a simulated camera ViewVertical {0,0,1} direction to make vertical WorkingPrecision MachinePrecision the precision used in internal computations
List of all options


Examples
open all close allBasic Examples (4)
Scope (16)
Sampling (6)
Plot over an implicitly defined region:
More points are sampled where the function changes quickly:
Areas where the function becomes nonreal are excluded:
Use PlotPoints and MaxRecursion to control adaptive sampling:
Use RegionFunction to show interior features:
Presentation (10)
Options (102)
Axes (2)
By default, Axes is drawn for ContourPlot3D:
Use AxesFalse to turn off axes:
Turn axes on individually for ContourPlot3D:
AxesLabel (4)
No axes labels are drawn by default:
Use labels based on variables specified in ContourPlot3D:
AxesOrigin (2)
AxesStyle (4)
BoundaryStyle (3)
Use a red boundary around the edges of the contours:
Use None to omit the boundary:
BoundaryStyle applies to holes cut by RegionFunction:
BoxRatios (1)
Use Automatic to show the natural scale of the surface:
ColorFunction (5)
Color the contours according to the ![]() ,
, ![]() ,
, ![]() , or
, or ![]() values:
values:
ColorFunction has higher priority than ContourStyle:
ColorFunction has lower priority than MeshShading:
ColorFunctionScaling (2)
Contours (4)
ContourStyle (8)
Use distinct colors for each contour:
Use FaceForm to get different colors on the inside and outside:
Alternate styles for contour surfaces:
Use the same style for all the equations:
Use different styles for different equations:
ColorFunction has higher priority than ContourStyle:
MeshShading has higher priority than ContourStyle:
EvaluationMonitor (2)
ImageSize (7)
Use named sizes such as Tiny, Small, Medium and Large:
Specify the width of the plot:
Specify the same height of plots with different aspect ratios:
Allow the width and height to be up to a certain maximum size:
Specify the width and height for a graphic, padding with space if necessary:
Setting AspectRatioFull will fill the available space:
Use maximum sizes for the width and height:
Use ImageSizeFull to fill the available space in an object:
Specify the image size as a fraction of the available space:
Mesh (6)
Show the initial and final sampling meshes:
Use None to not draw any mesh:
Use 5 mesh levels in each direction:
Use 5 mesh levels in the ![]() direction and 10 in the
direction and 10 in the ![]() direction:
direction:
MeshFunctions (2)
MeshShading (5)
Alternate red and blue sections in the ![]() direction:
direction:
MeshShading has higher priority than ContourStyle for styling:
Use ContourStyle for some segments by setting MeshShading to Automatic:
MeshShading can be used with ColorFunction:
MeshStyle (2)
NormalsFunction (3)
Normals are automatically calculated:
Use None to get flat shading for all the polygons:
PerformanceGoal (2)
PlotLegends (3)
Use Placed to change legend placement:
Use SwatchLegend to modify the legend:
PlotRange (2)
PlotTheme (4)
RegionBoundaryStyle (4)
Show the region being plotted:
Show the region defined by a region function:
Use None to not draw the region:
Use a custom RegionBoundaryStyle:
ScalingFunctions (4)
By default, ContourPlot3D uses linear scales in all directions:
Use a log scale in the ![]() direction:
direction:
Reverse the coordinate direction of the ![]() axis:
axis:
Use a scale defined by a function, specifying the function and its inverse:
TextureCoordinateFunction (5)
Ticks (6)
Ticks are placed automatically in each plot:
Use TicksNone to not draw any tick marks or tick labels:
Place tick marks at specific positions:
Draw tick marks at the specified positions with the specified labels:
Specify tick marks with scaled lengths:
Customize each tick with position, length, labeling and styling:
TicksStyle (3)
Applications (5)
Ellipsoidal surfaces [more info]:
Conic surfaces [more info]:
Show a sphere and hyperboloids of one and two sheets:
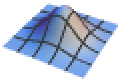
Use Mesh to show that a hyperbolic paraboloid is a doubly ruled surface:
An implicitly defined torus [more info]:
An electrostatic potential built from a collection of point charges ![]() at positions
at positions ![]() :
:
Properties & Relations (8)
ContourPlot3D samples more points where it needs to:
Plotting an implicit surface is the same as finding the zero contour of a related function:
The orientation of the contours depends on the form of the input:
Use ListContourPlot3D for plotting data:
Use RegionPlot3D for implicit regions in three dimensions:
Use Plot3D for surfaces:
Use ParametricPlot3D for parametric curves and regions in three dimensions:
Use ContourPlot and DensityPlot for contours and densities in two dimensions:
Possible Issues (3)
Use increased settings for PlotPoints or MaxRecursion to capture features of a surface:
Use more initial points to capture more components of the contour surface:
For functions that are always non-negative, it is not possible to find the 0 contour:
Text
Wolfram Research (2007), ContourPlot3D, Wolfram Language function, https://reference.wolfram.com/language/ref/ContourPlot3D.html (updated 2022).
CMS
Wolfram Language. 2007. "ContourPlot3D." Wolfram Language & System Documentation Center. Wolfram Research. Last Modified 2022. https://reference.wolfram.com/language/ref/ContourPlot3D.html.
APA
Wolfram Language. (2007). ContourPlot3D. Wolfram Language & System Documentation Center. Retrieved from https://reference.wolfram.com/language/ref/ContourPlot3D.html