ScalingFunctions


ScalingFunctions
Details
- Scaling functions transform the appearance of elements in plots and charts.
- The values shown on frames and axes in a plot are specially chosen based on the scaling functions.
- Scaling functions are used to display coordinates in a way that makes it easier to see features or behaviors in a plot.
- Axes and other labels are typically shown using the original, unscaled values so they can be read directly, without need for further rescaling. The specific values shown depend on the scaling function and may not be linearly spaced.
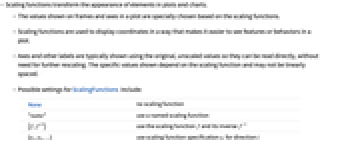
- Possible settings for ScalingFunctions include:
-
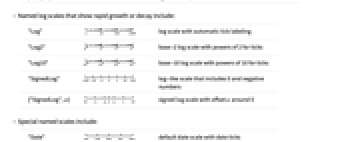
None no scaling function "name" use a named scaling function {f,f-1} use the scaling function f and its inverse f-1 {s1,s2,…} use scaling function specification si for direction i - Named log scales that show rapid growth or decay include:
-
"Log" 
log scale with automatic tick labeling "Log2" 
base-2 log scale with powers of 2 for ticks "Log10" 
base-10 log scale with powers of 10 for ticks "SignedLog" 
log-like scale that includes 0 and negative numbers {"SignedLog",α} 
signed log scale with offset α around 0 - Special named scales include:
-
"Date" 
default date scale with date ticks "Time" 
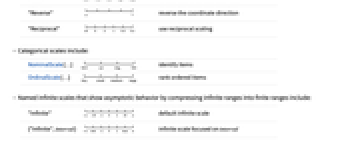
time scale with time ticks "Reverse" 
reverse the coordinate direction "Reciprocal" 
use reciprocal scaling - Categorical scales include:
-
NominalScale[…] 
identify items OrdinalScale[…] 
rank ordered items - Named infinite scales that show asymptotic behavior by compressing infinite ranges into finite ranges include:
-
"Infinite" 
default infinite scale {"Infinite",interval} 
infinite scale focused on interval - Infinite scales are automatically used when plotting over infinite domains.
- Options are specified using the original coordinates and are automatically processed by the scaling functions.
- Ticks, GridLines, etc. indicate unscaled values but at a scaled location.
- With ScalingFunctions->"Log", CandlestickChart, RenkoChart, and other financial visualization functions plot the prices on a log scale.
Examples
Basic Examples (6)
Show a function with log-scaled values:
Show a BarChart with log-scaled heights:
Generate a Histogram on log-log scales:
Generate a BubbleChart with the ![]() axis reversed and the
axis reversed and the ![]() axis on a Weibull probability scale:
axis on a Weibull probability scale:
Wolfram Research (2010), ScalingFunctions, Wolfram Language function, https://reference.wolfram.com/language/ref/ScalingFunctions.html (updated 2025).
Text
Wolfram Research (2010), ScalingFunctions, Wolfram Language function, https://reference.wolfram.com/language/ref/ScalingFunctions.html (updated 2025).
CMS
Wolfram Language. 2010. "ScalingFunctions." Wolfram Language & System Documentation Center. Wolfram Research. Last Modified 2025. https://reference.wolfram.com/language/ref/ScalingFunctions.html.
APA
Wolfram Language. (2010). ScalingFunctions. Wolfram Language & System Documentation Center. Retrieved from https://reference.wolfram.com/language/ref/ScalingFunctions.html