SurfaceGraphics
As of Version 6.0, SurfaceGraphics has been superseded by GraphicsComplex and related functionality.
SurfaceGraphics[array]
is a representation of a three-dimensional plot of a surface, with heights of each point on a grid specified by values in array.
SurfaceGraphics[array,shades]
represents a surface, whose parts are shaded according to the array shades.
Details and Options
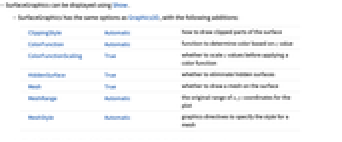
- SurfaceGraphics can be displayed using Show.
- SurfaceGraphics has the same options as Graphics3D, with the following additions:
-
ClippingStyle Automatic how to draw clipped parts of the surface ColorFunction Automatic function to determine color based on z value ColorFunctionScaling True whether to scale z values before applying a color function HiddenSurface True whether to eliminate hidden surfaces Mesh True whether to draw a mesh on the surface MeshRange Automatic the original range of x, y coordinates for the plot MeshStyle Automatic graphics directives to specify the style for a mesh - For SurfaceGraphics, the default setting for BoxRatios is BoxRatios->{1,1,0.4}.
- array should be a rectangular array of real numbers, representing z values. There will be holes in the surface corresponding to any array elements that are not real numbers.
- If array has dimensions
 , then shades must have dimensions
 .
. - The elements of shades must be GrayLevel, Hue, or RGBColor directives.
- Graphics3D[SurfaceGraphics[…]] can be used to convert a SurfaceGraphics object into the more general Graphics3D representation.
- SurfaceGraphics is generated by Plot3D and ListPlot3D.
Wolfram Research (1988), SurfaceGraphics, Wolfram Language function, https://reference.wolfram.com/language/ref/SurfaceGraphics.html.
Text
Wolfram Research (1988), SurfaceGraphics, Wolfram Language function, https://reference.wolfram.com/language/ref/SurfaceGraphics.html.
CMS
Wolfram Language. 1988. "SurfaceGraphics." Wolfram Language & System Documentation Center. Wolfram Research. https://reference.wolfram.com/language/ref/SurfaceGraphics.html.
APA
Wolfram Language. (1988). SurfaceGraphics. Wolfram Language & System Documentation Center. Retrieved from https://reference.wolfram.com/language/ref/SurfaceGraphics.html