|
2.5.4 Root Locus Plots
Let  denote a rational transfer function whose coefficients depend on the real parameter denote a rational transfer function whose coefficients depend on the real parameter  . A root locus plot shows the locus of the poles and zeros of . A root locus plot shows the locus of the poles and zeros of  in the complex plane as in the complex plane as  varies within an interval varies within an interval  . .
To draw a root locus plot use the command RootLocusPlot. The calling format is
RootLocusPlot[tfunc,   , ,  , ,   ] ]
where tfunc is a transfer function in the frequency variable  and one real parameter and one real parameter  . .
Of course, the parameter does not necessarily have to be named k. We can also use any other symbol to denote the parameter. Below, we define the transfer function H4[s, a] with coefficients which are functions of the parameter a.
In[12]:= H4[s_, a_] := (a + 2*s + s^2)/(10 + 3*a*s + 4*s^2 + s^3)
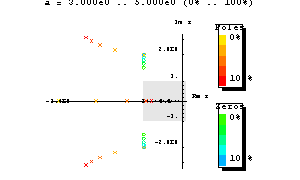
Then we graph the root locus of H4 as a varies from  to to  . By default, RootLocusPlot samples the parameter interval at five equally spaced points. This number can be increased or decreased by means of the PlotPoints option. The poles and zeros of the transfer function are displayed as red crosses and green circles, respectively. . By default, RootLocusPlot samples the parameter interval at five equally spaced points. This number can be increased or decreased by means of the PlotPoints option. The poles and zeros of the transfer function are displayed as red crosses and green circles, respectively.
In[13]:= RootLocusPlot[H4[s, a], {a, 3, 5}]
Out[13]= 
RootLocusPlot Options
RootLocusPlot inherits its options from Graphics and adds its own options like PoleStyle and ZeroStyle to Options[RootLocusPlot]. With these options you can customize the display of poles and zeros, e.g. for better black-and-white printouts. The syntax of the PoleStyle option is
PoleStyle -> mark[size, colorfunc, grstyle]
where mark specifies the marker symbol (e.g. CrossMark, PlusMark, CircleMark, SquareMark, and PointMark), size denotes the size of the marker in scaled coordinates, colorfunc is a pure function that returns a color value for an argument between  and and  , and grstyle is a Mathematica graphics style or a sequence of styles, such as Hue or Thickness. Note that everything mentioned above applies to the ZeroStyle option as well. , and grstyle is a Mathematica graphics style or a sequence of styles, such as Hue or Thickness. Note that everything mentioned above applies to the ZeroStyle option as well.
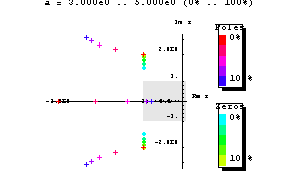
In the following command line we instruct RootLocusPlot to modify the styles for the pole and zero markers:
In[14]:= RootLocusPlot[H4[s, a],{a, 3, 5},
PoleStyle -> PlusMark[0.03, Hue[1-0.3*#] &,
Thickness[0.012]],
ZeroStyle -> PointMark[0.03, Hue[0.5-0.3*#] &,
Thickness[0.005]]]
Out[14]= 
Pole-Zero Plots of Transfer Functions Without Parameters
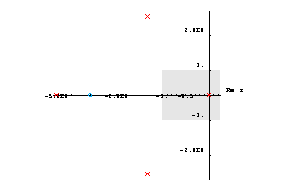
The RootLocusPlot function can also be used to display the pole and zero locations of transfer functions without parameters. For this purpose, RootLocusPlot must be called with a univariate transfer function, and no parameter interval must be passed as a second argument.
In[15]:= RootLocusPlot[H3[s]]
Out[15]= 
Animating Root Locus Plots
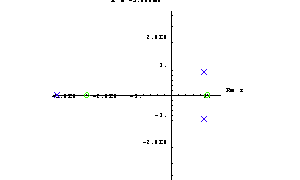
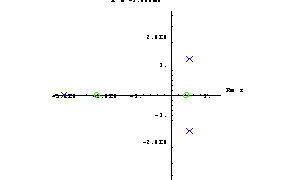
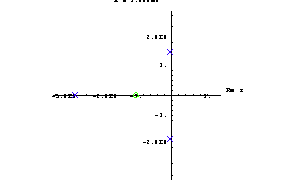
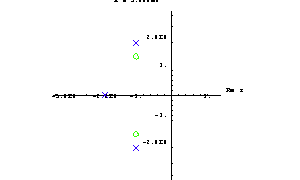
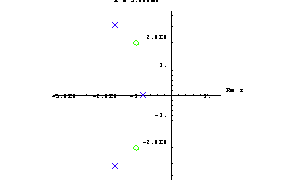
Sometimes it is helpful to animate a root locus plot because this shows the orientations of the pole and zero trajectories better than a static plot. Let's demonstrate root locus plot animation on the transfer function H4[s, a] from above. To prepare the animation we compute a sequence of pole-zero plots with identical plot ranges by mapping the following RootLocusPlot function to a table of parameter values ranging from  to to  in steps of in steps of  . This is necessary because we want to produce one separate plot in every parameter step instead of one single plot in which the solutions from all steps are superimposed. . This is necessary because we want to produce one separate plot in every parameter step instead of one single plot in which the solutions from all steps are superimposed.
In[16]:= RootLocusPlot[H4[s, a], {a, #, #},
PoleStyle -> CrossMark[0.03, Hue[0.7] &,
Thickness[0.007]],
ZeroStyle -> CircleMark[0.03, Hue[0.3] &,
Thickness[0.007]],
PlotRange -> {{-6, 1}, {-4, 4}},
ShowLegend -> False,
LinearRegionStyle -> RGBColor[1, 1, 1]
] & /@ Table[x, {x, -3, 5, 2}]
Out[16]= 
To animate the root locus plot double-click on one of the images. Alternatively, you can select the resulting group of notebook cells containing the images with your mouse and then click on Cell | Animate Selected Graphics in Mathematica's frontend menu.
|