CorrelationTest
CorrelationTest[{{x1,y1},{x2,y2},…}]
tests whether the correlation coefficient for a bivariate population is zero.
CorrelationTest[{{x1,y1},{x2,y2},…},ρ0]
tests whether the correlation coefficient is ρ0.
CorrelationTest[{{x1,y1},{x2,y2},…},{{u1,v1},{u2,v2},…}]
tests whether the correlation coefficients for two populations are equal.
CorrelationTest[…,"property"]
returns the value of "property".
Details and Options
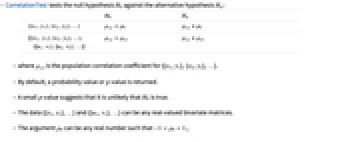
- CorrelationTest tests the null hypothesis
 against the alternative hypothesis
  :
: -


{{{x1,y1},{x2,y2},…},{{u1,v1},{u2,v2},…}} 

- where ρx,y is the population correlation coefficient for {{x1,y1},{x2,y2},…}.
- By default, a probability value or
 -value is returned.
 - A small
 -value suggests that it is unlikely that
  is true.
 - The data {{x1,y1},…} and {{u1,v1},…} can be any real-valued bivariate matrices.
- The argument ρ0 can be any real number such that
 .,
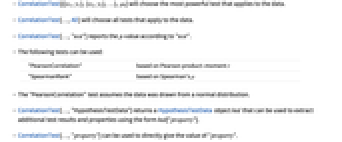
., - CorrelationTest[{{x1,y1},{x2,y2},…},ρ0] will choose the most powerful test that applies to the data.
- CorrelationTest[…,All] will choose all tests that apply to the data.
- CorrelationTest[…,"test"] reports the
 -value according to "test".
 - The following tests can be used:
-
"PearsonCorrelation" based on Pearson product-moment 
"SpearmanRank" based on Spearman's 
- The "PearsonCorrelation" test assumes the data was drawn from a normal distribution.
- CorrelationTest[…,"HypothesisTestData"] returns a HypothesisTestData object htd that can be used to extract additional test results and properties using the form htd["property"].
- CorrelationTest[…,"property"] can be used to directly give the value of "property".
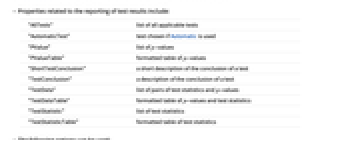
- Properties related to the reporting of test results include:
-
"AllTests" list of all applicable tests "AutomaticTest" test chosen if Automatic is used "PValue" list of  -values
"PValueTable" formatted table of  -values
"ShortTestConclusion" a short description of the conclusion of a test "TestConclusion" a description of the conclusion of a test "TestData" list of pairs of test statistics and  -values
"TestDataTable" formatted table of  -values and test statistics
"TestStatistic" list of test statistics "TestStatisticTable" formatted table of test statistics - The following options can be used:
-
AlternativeHypothesis "Unequal" the inequality for the alternative hypothesis SignificanceLevel 0.05 cutoff for diagnostics and reporting VerifyTestAssumptions Automatic what assumptions to verify - For tests of correlation, a cutoff
 is chosen such that
  is rejected only if
  . The value of
  used for the "TestConclusion" and "ShortTestConclusion" properties is controlled by the SignificanceLevel option. This value
  is also used in diagnostic tests of normality. By default,
  is set to 0.05.
 - Named settings for VerifyTestAssumptions in CorrelationTest include:
-
"Normality" verify that all data is normally distributed
Examples
open allclose allBasic Examples (3)
Scope (13)
Testing (9)
Test whether the population correlation coefficient is zero:
The ![]() -values are typically large when the true correlation is near zero:
-values are typically large when the true correlation is near zero:
The ![]() -values are typically small when the true correlation is not zero:
-values are typically small when the true correlation is not zero:
Test whether the population correlation coefficient is 0.5:
The ![]() -values are typically large when the true correlation is near the hypothesized value:
-values are typically large when the true correlation is near the hypothesized value:
The ![]() -values are typically small when the true correlation is far from the hypothesized value:
-values are typically small when the true correlation is far from the hypothesized value:
Compare correlation coefficients from two samples:
The ![]() -values are typically large when the correlations are similar:
-values are typically large when the correlations are similar:
The ![]() -values are typically small when the correlations are dissimilar:
-values are typically small when the correlations are dissimilar:
Using Automatic applies the most powerful appropriate test:
The property "AutomaticTest" can be used to determine which test was chosen:
Any number of tests can be performed simultaneously:
Perform all tests appropriate to the data simultaneously:
Use the property "AllTests" to identify which tests were used:
Create a HypothesisTestData object for repeated property extraction:
The properties available for extraction:
Extract some properties from the HypothesisTestData object:
The ![]() -value and test statistic from the "PearsonCorrelation" test:
-value and test statistic from the "PearsonCorrelation" test:
Reporting (4)
Tabulate the results from a selection of tests:
A full table of all appropriate test results:
Retrieve the entries from a test table for customized reporting:
The ![]() -values are above 0.05, so there is not enough evidence to reject
-values are above 0.05, so there is not enough evidence to reject ![]() at that level:
at that level:
Tabulate ![]() -values for a test or group of tests:
-values for a test or group of tests:
A table of ![]() -values from all appropriate tests:
-values from all appropriate tests:
Tabulate test statistics for a test or group of tests:
Options (8)
AlternativeHypothesis (2)
SignificanceLevel (3)
Set the significance level for diagnostic tests:
By default, 0.05 is used. The message shows 0.025 because two tests were performed:
Setting the significance level may alter which test is automatically chosen:
A nonparametric test would have been chosen by default:
The significance level is also used for "TestConclusion" and "ShortTestConclusion":
Properties & Relations (5)
The ![]() -value is computed using the Fisher
-value is computed using the Fisher ![]() transformation of the sample correlation r:
transformation of the sample correlation r:
The Fisher ![]() transformation with
transformation with ![]() :
:
The same transformation is used for "SpearmanRank":
A similar transformation is used when comparing correlations:
The statistics are equivalent:
The transformed statistic has an asymptotic standard normal distribution under ![]() :
:
Use IndependenceTest to test for independence between vectors and matrices:
The correlation test works with the time stamps and the values when the input is a TimeSeries:
Possible Issues (3)
CorrelationTest should not be used to test causation:
The high degree of correlation results from sorting:
Causation does not necessarily imply high correlation, either:
The correlation test will not recognize multivariate TimeSeries:

The correlation test will not thread over paths of TemporalData:
Text
Wolfram Research (2012), CorrelationTest, Wolfram Language function, https://reference.wolfram.com/language/ref/CorrelationTest.html.
CMS
Wolfram Language. 2012. "CorrelationTest." Wolfram Language & System Documentation Center. Wolfram Research. https://reference.wolfram.com/language/ref/CorrelationTest.html.
APA
Wolfram Language. (2012). CorrelationTest. Wolfram Language & System Documentation Center. Retrieved from https://reference.wolfram.com/language/ref/CorrelationTest.html