


TimeSeries
TimeSeries[{{t1,v1},{t2,v2}…}]
represents a time series specified by time-value pairs {ti,vi}.
TimeSeries[{v1,v2,…},tspec]
represents a time series with values vi at times specified by tspec.
Details and Options
- TimeSeries represents a series of time-value pairs {ti,vi}.
- The values vi can be scalars or arrays of any dimension, but must all be of equal dimensionality.
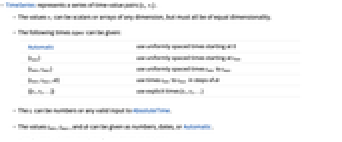
- The following times tspec can be given:
-
Automatic use uniformly spaced times starting at 0 {tmin} use uniformly spaced times starting at tmin {tmin,tmax} use uniformly spaced times tmin to tmax {tmin,tmax,dt} use times tmin to tmax in steps of dt {{t1,t2,…}} use explicit times {t1,t2,…} - The ti can be numbers or any valid input to AbsoluteTime.
- The values tmin, tmax, and dt can be given as numbers, dates, or Automatic.
- Specifying ts[t] gives the value of the time series at time t.
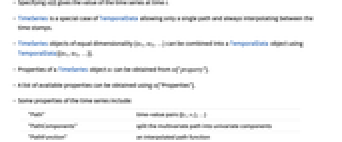
- TimeSeries is a special case of TemporalData allowing only a single path and always interpolating between the time stamps.
- TimeSeries objects of equal dimensionality {ts1,ts2,…} can be combined into a TemporalData object using TemporalData[{ts1,ts2,…}].
- Properties of a TimeSeries object ts can be obtained from ts["property"].
- A list of available properties can be obtained using ts["Properties"].
- Some properties of the time series include:
-
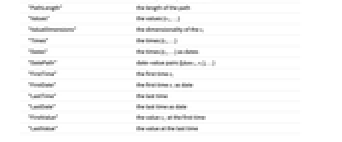
"Path" time-value pairs {{t1,v1},…} "PathComponents" split the multivariate path into univariate components "PathFunction" an interpolated path function "PathLength" the length of the path "Values" the values {v1,…} "ValueDimensions" the dimensionality of the vi "Times" the times {t1,…} "Dates" the times {t1,…} as dates "DatePath" date-value pairs {{date1,v1},…} "FirstTime" the first time t1 "FirstDate" the first time t1 as date "LastTime" the last time "LastDate" the last time as date "FirstValue" the value v1 at the first time "LastValue" the value at the last time - Specifying ts["PathComponent",p] gives the TimeSeries for vector components of the values specified by p.
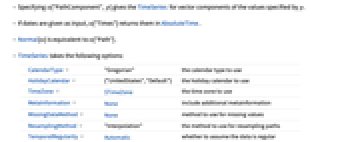
- If dates are given as input, ts["Times"] returns them in AbsoluteTime.
- Normal[ts] is equivalent to ts["Path"].
- TimeSeries takes the following options:
-
CalendarType "Gregorian" the calendar type to use HolidayCalendar {"UnitedStates","Default"} the holiday calendar to use TimeZone $TimeZone the time zone to use MetaInformation None include additional metainformation MissingDataMethod None method to use for missing values ResamplingMethod "Interpolation" the method to use for resampling paths TemporalRegularity Automatic whether to assume the data is regular DateFunction Automatic how to convert dates to standard form ValueDimensions Automatic the dimensions of the values - By default, first-order interpolation is used for resampling. The setting ResamplingMethod->{"Interpolation",opts} can be given, where opts are options passed to Interpolation.
- Setting the MissingDataMethod->Automatic will automatically interpolate values with head Missing according to the ResamplingMethod setting. By default, values with head Missing are treated as missing.
- The setting ValueDimensions->dim specifies that the values vij are of dimension dim. Setting ValueDimensions->Automatic attempts to automatically determine the dimension of the values from the data.
Examples
open all close allBasic Examples (2)
Create a time series from some values and times:
Plot the time series with DateListPlot:
Scope (33)
Basic Uses (10)
Use TimeSeriesWindow to extract a portion of a time series:
Use TimeSeriesInsert to replace a missing value:
Use TimeSeriesRescale to rescale a time series to run from 0 to 20:
Use TimeSeriesShift to shift the series ahead by 2:
Square the values in a time series:
Use TimeSeriesMap to find the sums of the components of a vector-valued time series:
Find the Mean of a time series:
The mean depends only on the values:
Compute a MovingAverage for a time series:
Use MovingMap to compute a moving maximum:
Use TimeSeriesAggregate to compute the weekly totals for a time series:
Fit a parametric model to a time series using TimeSeriesModelFit:
Use TimeSeriesForecast to forecast the next 10 values in the time series:
Plot the time series along with the forecast:
Use TimeSeriesThread to compute the differences between two time series:
Creating a Time Series (14)
Give a list of values with Automatic time stamps:
Create a time series starting at ![]() :
:
Dates can be given as any valid input to AbsoluteTime:
Use equally spaced times from 10 to 50:
Specify an Automatic endpoint:
Create a series with times 1 to 20 in steps of 2:
Use an Automatic endpoint and fixed step:
Extract the computed last date:
Use an Automatic start point and given frequency:
Extract the computed first time:
Explicitly specify the times to use:
Give an explicit list of dates:
Extracting Properties and Values (5)
Obtain a list of available properties:
Values used for the time series:
Represent the time series as a function:
Extract components of vector-valued collection:
Resample data over a given set of times:
Upsample the original path in steps of 0.25:
The new data is sampled from the path function:
Time series involving quantities:
The values are given as QuantityArray:
Time Series Arithmetic (4)
Numerical, listable functions automatically thread over values of time series:
Compare to the result of TimeSeriesMap:
Combining several time series with identical time stamps threads over values:
Time series are resampled at the union of time stamps in the intersection of their supports:
The intersection of supports is ![]() , and the union of the time stamps within is
, and the union of the time stamps within is ![]() :
:
Compare the result with adding the resampled time series:
Create a new time series of quantity magnitudes from existing time series involving quantities:
Options (12)
CalendarType (1)
Specify time stamps as dates in a specific calendar using CalendarType:
By default, the "Gregorian" calendar is being used:
Specify input dates in "Gregorian" calendar but display in "Jewish" calendar:
DateFunction (2)
Use DateList to define functions for interpreting ambiguous date strings:
Use DateObject to define functions for interpreting ambiguous date strings:
Specify the TimeZone of the inputs:
HolidayCalendar (1)
Use HolidayCalendar to visualize business days in a given country:
MetaInformation (3)
Include additional meta-information as a list of rules:
The properties now include the meta-information "Stock":
The added meta-information can be used like any other property:
Use MetaInformation to specify PlotLegends:
See the available MetaInformation:
Access specific information directly:
Use MetaInformation to name the components in a vector-valued TimeSeries:
Extract first and third components using either their name or number:
MissingDataMethod (1)
By default, values with head Missing are interpreted as missing:
Use MissingDataMethod to replace missing values with a constant:
ResamplingMethod (1)
By default, values at intermediate times are computed using first-order interpolation:
Use ResamplingMethod to assign a constant value at intermediate times:
TimeZone (1)
Specify the time zone of TimeSeries:
The time stamps were created in $TimeZone, but the dates are displayed in the time zone specified by the option:
Applications (13)
Astronomy (2)
Use SunPosition to generate the Sun's position in Chicago for a range of dates:
Plot the variation of the azimuth and the altitude for this period:
Use MoonPosition to generate the Moon's position for a range of dates:
Verify that the Moon's orbit is tilted with respect to the Earth's equator:
Demographics (1)
Use CountryData to generate the GDP for UK and Germany:
Weather (1)
Energy (1)
Use NuclearReactorData to visualize energy production for the Chernobyl reactors:
Meteorology (2)
Use AirPressureData to examine pressure reading drops due to Hurricane Sandy at Long Island MacArthur Airport:
Use WindSpeedData to compare the wind speeds at John F. Kennedy Airport during summer and winter:
Devices (2)
Capture a 10-second time series at 0.05-second intervals:
Plot the time series along with a moving average:
The following time series is generated by reading illuminance data from a TinkerForge Weather Station every 0.1 second for 5 seconds while continuously changing the device orientation:
Min, Mean, and Max for the data:
Generate illuminance data by alternately switching the ambient light source on and off:
A plot of the time series reveals the approximate periodic nature of the data:
Verify the periodicity using Fourier:
Filtering (1)
Use MeanFilter to filter a time series:
Sales (2)
The following data represents annual sales for a small software company for 11 years:
Use LinearModelFit to fit a linear model to this data:
Plot the original data along with the values obtained using the linear model:
Apply exponential smoothing with weight 0.45 to the data:
Plot the original data along with the values obtained using exponential smoothing:
Fit a parametric model to retail sales data for the US between 1992 and 2015:
Construct a time series model for the data using TimeSeriesModelFit:
Properties & Relations (4)
TimeSeries interpolates the values between time stamps:
Use EventSeries to represent discrete times:
However, EventSeries does not interpolate the values between time stamps:
You can convert from one to the other:
TimeSeries can contain a single path only:
The time series has only one path:
Create individual TimeSeries for each row of data:
Compare to the first row of the data:
Use TemporalData to contain multiple paths:
TimeSeries at a point returns a value or interpolates:
Evaluating at a time stamp and in between time stamps:
Use TemporalData to store multiple paths and obtain distribution of the values at a point:
Evaluating at a time stamp and in between time stamps:
TimeSeries at a time outside the time domain extrapolates:
The warning message is not being issued by default but can be turned on:
Possible Issues (6)
Multidimensional data may be confused with time-value pairs:
Specify ValueDimensions to treat the data as vector-valued:
Accumulating irregularly sampled time series:
Accumulate will resample to create regularly sampled time series:
Compare with accumulated values:
To recover that behavior, assume TemporalRegularity:
TimeSeries always interpolates between the time stamps:
To still have Missing between time stamps, use it as the value:
If the ResamplingMethod specification is not an implemented one, it will assume the value Automatic:
Component names must be strings:
Path component names must be non-empty strings:
Time series with repeated component names:
For a repeated name, only the first component will be repeatedly extracted:
Use an index to access the next components with the same name:
Text
Wolfram Research (2014), TimeSeries, Wolfram Language function, https://reference.wolfram.com/language/ref/TimeSeries.html (updated 2015).
CMS
Wolfram Language. 2014. "TimeSeries." Wolfram Language & System Documentation Center. Wolfram Research. Last Modified 2015. https://reference.wolfram.com/language/ref/TimeSeries.html.
APA
Wolfram Language. (2014). TimeSeries. Wolfram Language & System Documentation Center. Retrieved from https://reference.wolfram.com/language/ref/TimeSeries.html