


DateHistogram
DateHistogram[{date1,date2,…}]
plots a histogram of the dates datei.
DateHistogram[{date1,date2,…},bspec]
plots a histogram with bin width specification bspec.
DateHistogram[{date1,date2,…},bspec,hspec]
plots a histogram with bin heights computed according to the specification hspec.
DateHistogram[{data1,data2,…}]
plots histograms for multiple datasets datai.
Details and Options
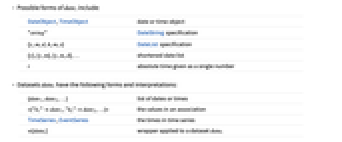
- Possible forms of datei include:
-
DateObject,TimeObject date or time object "string" DateString specification {y,m,d,h,m,s} DateList specification {y},{y,m},{y,m,d},… shortened date list t absolute time given as a single number - Datasets datai have the following forms and interpretations:
-
{date1,date2,…} list of dates or times <"k1"date1,"k2"date2,…> the values in an association TimeSeries,EventSeries the times in time series w[datai] wrapper applied to a dataset datai - DateHistogram[Tabular[…]cspec] extracts and plots values from the tabular object using the column specification cspec.
- The following forms of column specifications cspec are allowed for plotting tabular data:
-
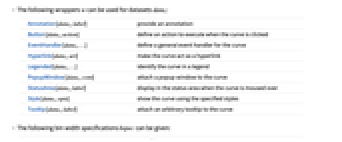
colx create a histogram for the dates in column colx {colx1,colx2,…} create histograms for columns colx1, colx2, … - The following wrappers w can be used for datasets datai:
-
Annotation[datai,label] provide an annotation Button[datai,action] define an action to execute when the curve is clicked EventHandler[datai,…] define a general event handler for the curve Hyperlink[datai,uri] make the curve act as a hyperlink Legended[datai,…] identify the curve in a legend PopupWindow[datai,cont] attach a popup window to the curve StatusArea[datai,label] display in the status area when the curve is moused over Style[datai,opts] show the curve using the specified styles Tooltip[datai,label] attach an arbitrary tooltip to the curve - The following bin width specifications bspec can be given:
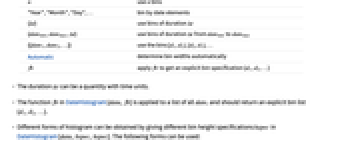
-
n use n bins "Year","Month","Day",… bin by date elements {Δt} use bins of duration Δt {datemin,datemax,Δt} use bins of duration Δt from datemin to datemax {{date1,date2,…}} use the bins [d1,d2),[d2,d3),… Automatic determine bin widths automatically fb apply fb to get an explicit bin specification {d1,d2,…} - The duration Δt can be a quantity with time units.
- The function fb in DateHistogram[data,fb] is applied to a list of all datei and should return an explicit bin list {d1,d2,…}.
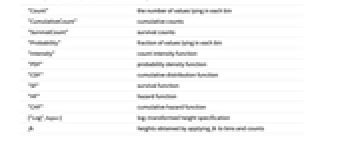
- Different forms of histogram can be obtained by giving different bin height specifications hspec in DateHistogram[data,bspec,hspec]. The following forms can be used:
-
"Count" the number of values lying in each bin "CumulativeCount" cumulative counts "SurvivalCount" survival counts "Probability" fraction of values lying in each bin "Intensity" count intensity function "PDF" probability density function "CDF" cumulative distribution function "SF" survival function "HF" hazard function "CHF" cumulative hazard function {"Log",hspec} log-transformed height specification fh heights obtained by applying fh to bins and counts - The function fh in DateHistogram[data,bspec,fh] is applied to two arguments: a list of bins {{d1,d2},{d2,d3},…} and a corresponding list of counts {c1,c2,…}. The function should return a list of heights to be used for each of the ci.
- Only datei that are dates or times are assigned to bins; others are taken to be missing.
- In DateHistogram[{data1,data2,…},…], automatic bin locations are determined by combining all the datasets datai.
- DateHistogram[{…,wi[datai,…],…},…] renders the histogram elements associated with dataset datai according to the specification defined by the symbolic wrapper wi.
- Possible symbolic wrappers are the same as for BarChart and include Style, Labeled, Legended, etc.
- DateHistogram has the same options as Graphics, with the following additions and changes: [List of all options]
-
AspectRatio 1/GoldenRatio overall ratio of height to width Axes True whether to draw axes BarOrigin Bottom origin of histogram bars ChartBaseStyle Automatic overall style for bars ChartElementFunction Automatic how to generate raw graphics for bars ChartElements Automatic graphics to use in each of the bars ChartLabels None category labels for datasets ChartLayout Automatic overall layout to use ChartLegends None legends for data elements and datasets ChartStyle Automatic style for bars ColorFunction Automatic how to color bars ColorFunctionScaling True whether to normalize arguments to ColorFunction DateFunction Automatic how to convert dates to standard form DateReduction None what cyclic period of time to use DateTicksFormat Automatic format for date tick labels LabelingFunction Automatic how to label elements LegendAppearance Automatic overall appearance of legends PerformanceGoal $PerformanceGoal aspects of performance to try to optimize PlotTheme $PlotTheme overall theme for the histogram TimeZone Automatic time zone to use - The following settings for ChartLayout can be used to display multiple sets of data:
-
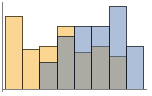
"Overlapped" show all the data overlapping 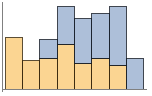
"Stacked" accumulate the data per bin - Possible settings for ChartLayout that show single groups of bars in multiple chart panels include:
-
"Column" use separate groups of bars in a column of panels "Row" use separate groups of bars in a row of panels {"Column",k},{"Row",k} use k columns or rows {"Column",UpTo[k]},{"Row",UpTo[k]} use at most k columns or rows - The arguments supplied to ChartElementFunction are the bin region {{xmin,xmax},{ymin,ymax}}, the bin values lists, and metadata {m1,m2,…} from each level in a nested list of datasets.
- A list of built-in settings for ChartElementFunction can be obtained from ChartElementData["DateHistogram"].
- The argument supplied to ColorFunction is the height for each bin.
- Style and other specifications from options and other constructs in DateHistogram are effectively applied in the order ChartStyle, ColorFunction, Style and other wrappers, ChartElements, and ChartElementFunction, with later specifications overriding earlier ones.
-
 Highlight options with settings specific to DateHistogram
-
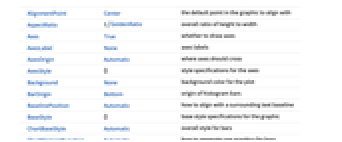
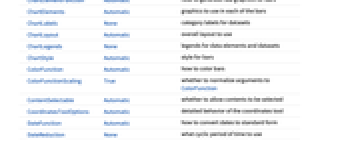
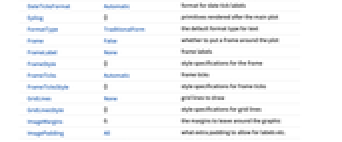
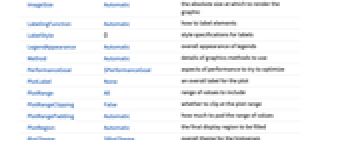
AlignmentPoint Center the default point in the graphic to align with AspectRatio 1/GoldenRatio overall ratio of height to width Axes True whether to draw axes AxesLabel None axes labels AxesOrigin Automatic where axes should cross AxesStyle {} style specifications for the axes Background None background color for the plot BarOrigin Bottom origin of histogram bars BaselinePosition Automatic how to align with a surrounding text baseline BaseStyle {} base style specifications for the graphic ChartBaseStyle Automatic overall style for bars ChartElementFunction Automatic how to generate raw graphics for bars ChartElements Automatic graphics to use in each of the bars ChartLabels None category labels for datasets ChartLayout Automatic overall layout to use ChartLegends None legends for data elements and datasets ChartStyle Automatic style for bars ColorFunction Automatic how to color bars ColorFunctionScaling True whether to normalize arguments to ColorFunction ContentSelectable Automatic whether to allow contents to be selected CoordinatesToolOptions Automatic detailed behavior of the coordinates tool DateFunction Automatic how to convert dates to standard form DateReduction None what cyclic period of time to use DateTicksFormat Automatic format for date tick labels Epilog {} primitives rendered after the main plot FormatType TraditionalForm the default format type for text Frame False whether to put a frame around the plot FrameLabel None frame labels FrameStyle {} style specifications for the frame FrameTicks Automatic frame ticks FrameTicksStyle {} style specifications for frame ticks GridLines None grid lines to draw GridLinesStyle {} style specifications for grid lines ImageMargins 0. the margins to leave around the graphic ImagePadding All what extra padding to allow for labels etc. ImageSize Automatic the absolute size at which to render the graphic LabelingFunction Automatic how to label elements LabelStyle {} style specifications for labels LegendAppearance Automatic overall appearance of legends Method Automatic details of graphics methods to use PerformanceGoal $PerformanceGoal aspects of performance to try to optimize PlotLabel None an overall label for the plot PlotRange All range of values to include PlotRangeClipping False whether to clip at the plot range PlotRangePadding Automatic how much to pad the range of values PlotRegion Automatic the final display region to be filled PlotTheme $PlotTheme overall theme for the histogram PreserveImageOptions Automatic whether to preserve image options when displaying new versions of the same graphic Prolog {} primitives rendered before the main plot RotateLabel True whether to rotate y labels on the frame Ticks Automatic axes ticks TicksStyle {} style specifications for axes ticks TimeZone Automatic time zone to use
List of all options
Examples
open all close allBasic Examples (5)
Scope (22)
Data and Layouts (8)
Specify the bin width in a time unit:
Specify number of bins to use:
Use different time units as bin width:
Delimit bins on the first date of every month with a binning function:
Use different height specifications:
Keys in Association are ignored:
Dates and times in TimeSeries, EventSeries, and TemporalData are plotted:
Use different layouts to display multiple datasets:
Use rows and columns of individual plots to show multiple sets:
Tabular Data (1)
Get tabular data for the biggest daily percentage change of the SP500:
Generate a histogram to compare the decades with the biggest occurrences for sharp movements:
See the months with the biggest movements:
Use PivotToColumns to generate columns of dates grouped as increase or decrease:
Wrappers (2)
Use wrappers on individual data, datasets, or collections of datasets:
Use PopupWindow to provide additional drilldown information:
Button can be used to trigger any action:
Styling and Appearance (4)
Use an explicit list of styles for the bars:
Use any gradient or indexed color schemes from ColorData:
ChartBaseStyle can be used to set an initial style for all chart elements:
Style can be used to override styles:
Use any graphic for pictorial bars:
Use built-in programmatically generated bars:
Labeling and Legending (7)
Use Labeled to add a label to a dataset:
Use symbolic positions for label placement:
Provide value labels for bars by using LabelingFunction:
Use Placed to control placement and formatting:
Add categorical legend entries for datasets:
Used Legended to add additional legend entries:
Use Placed to affect the positioning of legends:
Options (62)
AspectRatio (2)
By default, DateHistogram uses a fixed height to width ratio for the plot:
Use AspectRatio1 to make the height the same as the width:
BarOrigin (1)
ChartBaseStyle (4)
Use ChartBaseStyle to style bars:
ChartBaseStyle combines with ChartStyle:
ChartStyle may override settings for ChartBaseStyle:
ChartBaseStyle combines with Style:
Style may override settings for ChartBaseStyle:
ChartBaseStyle combines with ColorFunction:
ColorFunction may override settings for ChartBaseStyle:
ChartElementFunction (4)
Get a list of built-in settings for ChartElementFunction:
For detailed settings, use Palettes ▶ ChartElementSchemes:
Use the appropriate ChartElementFunction to show the global scale:
Write a custom ChartElementFunction:
Built-in element functions may have options; use Palettes ▶ ChartElementSchemes to set them:
ChartElements (9)
Create a pictorial chart based on any Graphics object:
Use a stretched version of the graphic:
Use scaled sizes for width and height:
Using All for width or height causes that direction to stretch to the full size of the bar:
Use a different graphic for each row of data:
Styles are inherited from styles set through ChartStyle etc.:
Style can override the settings from ChartStyle:
Explicit styles set in the graphic will override other style settings:
ChartLabels (6)
Place dataset labels above each histogram:
Labeled wrappers around datasets will place additional labels:
Use Placed to control label placement:
Symbolic positions outside the bar:
Coordinate-based placement relative to a histogram:
Place all labels at the lower-left corner and vary the coordinates within the label:
Use the third argument to Placed to control formatting:
ChartLayout (4)
ChartLegends (2)
ChartStyle (5)
Use ChartStyle to style bars:
Use "Gradient" colors from ColorData:
Use "Indexed" colors from ColorData:
Style overrides settings for ChartStyle:
ColorFunction overrides settings for ChartStyle:
ChartElements may override settings for ChartStyle:
ColorFunction (4)
Use ColorFunctionScalingFalse to get unscaled height values:
ColorFunction overrides styles in ChartStyle:
Use ColorFunction to combine different style effects:
ColorFunctionScaling (2)
By default, scaled height values are used:
Use ColorFunctionScaling False to get unscaled height values:
DateReduction (1)
LabelingFunction (7)
Use automatic labeling by values through Tooltip and StatusArea:
Use symbolic positions to control label placement:
Coordinate-based placement relative to a bar:
Control the formatting of labels:
Use the dataset position index to generate the label:
Use the given chart labels as arguments to the labeling function:
PerformanceGoal (1)
PlotRangePadding (3)
PlotTheme (2)
TimeZone (1)
Plots are shown using the setting of $TimeZone:
Applications (4)
Histogram of the independence date of European countries:
The magnitude of earthquakes with magnitude at least 6:
Show the distributions of earthquakes' magnitudes:
Show the distributions of the dates of earthquakes:
Analyze the distribution of movie release dates:
Show the distribution in years:
Show how the release dates distribute in each month:
Analyze the distribution of emails:
Text
Wolfram Research (2015), DateHistogram, Wolfram Language function, https://reference.wolfram.com/language/ref/DateHistogram.html (updated 2025).
CMS
Wolfram Language. 2015. "DateHistogram." Wolfram Language & System Documentation Center. Wolfram Research. Last Modified 2025. https://reference.wolfram.com/language/ref/DateHistogram.html.
APA
Wolfram Language. (2015). DateHistogram. Wolfram Language & System Documentation Center. Retrieved from https://reference.wolfram.com/language/ref/DateHistogram.html