KendallTau
KendallTau[v1,v2]
gives Kendall's rank correlation coefficient ![]() for the vectors v1 and v2.
for the vectors v1 and v2.
KendallTau[m]
gives Kendall's rank correlation coefficients ![]() for the matrix m.
for the matrix m.
KendallTau[m1,m2]
gives Kendall's rank correlation coefficients ![]() for the matrices m1 and m2.
for the matrices m1 and m2.
KendallTau[dist]
gives Kendall's rank correlation matrix for the multivariate symbolic distribution dist.
KendallTau[dist,i,j]
gives the ![]()
![]() Kendall rank correlation for the multivariate symbolic distribution dist.
Kendall rank correlation for the multivariate symbolic distribution dist.
Details
- KendallTau[v1,v2] gives Kendall's rank correlation coefficient
 between v1 and v2.
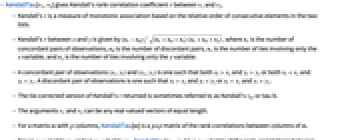
 - Kendall's
 is a measure of monotonic association based on the relative order of consecutive elements in the two lists.
 - Kendall's
 between
  and
and  is given by
  , where
  is the number of concordant pairs of observations,
  is the number of discordant pairs,
  is the number of ties involving only the
  variable, and
  is the number of ties involving only the
  variable.
 - A concordant pair of observations
 and
and  is one such that both
  and
and  or both
  and
and  . A discordant pair of observations is one such that
  and
and  or
or  and
and  .
. - The tie-corrected version of Kendall's
 returned is sometimes referred to as Kendall's
  , or tau-b.
 - The arguments v1 and v2 can be any real‐valued vectors of equal length.
- For a matrix m with
 columns, KendallTau[m] is a
  ×
× matrix of the rank‐correlations between columns of m.
 - For an
 ×
× matrix m1 and an
  ×
× matrix m2, KendallTau[m1,m2] is a
  ×
× matrix of the rank‐correlations between columns of m1 and columns of m2.
 - KendallTau[dist,i,j] is the probability of concordance minus the probability of discordance Probability[(x1-x2)(y1-y2)>0,{{x1,y1}disti,j,{x2,y2}disti,j}]-Probability[(x1-x2)(y1-y2)<0,{{x1,y1}disti,j,{x2,y2}disti,j}] where disti,j is the

") marginal of dist.
marginal of dist. - KendallTau[dist] gives a matrix
 where the
") entry is given by KendallTau[dist,i,j].
entry is given by KendallTau[dist,i,j].
Examples
open allclose allBasic Examples (4)
Scope (7)
Data (4)
Exact input yields exact output:
Approximate input yields approximate output:
SparseArray data can be used:
Applications (4)
Kendall's ![]() is typically used to detect linear dependence between two vectors:
is typically used to detect linear dependence between two vectors:
The absolute magnitude of ![]() tends to 1 given strong linear dependence:
tends to 1 given strong linear dependence:
The value tends to 0 for linearly independent vectors:
Kendall's ![]() can be used to measure linear association:
can be used to measure linear association:
Kendall's ![]() can only detect monotonic association:
can only detect monotonic association:
HoeffdingD can be used to detect other dependence structures:
A series of factors was measured in 506 Boston suburbs with the intention of determining how these factors are related to home price. Significant correlations among factors such as nitrogen oxide concentration and median home price serve as a reminder that correlation does not imply causation:
A scatter plot matrix comparing the percentage of non-retail businesses, nitrogen oxide concentration, and median home value:
Kendall's ![]() matrix for the scatter plot matrix:
matrix for the scatter plot matrix:
KendallTauTest suggests home values drop with increasing nitrogen oxide concentrations:
Properties & Relations (8)
Kendall's ![]() ranges from -1 to 1 for high negative and high positive association, respectively:
ranges from -1 to 1 for high negative and high positive association, respectively:
Kendall's ![]() matrix is symmetric:
matrix is symmetric:
The diagonal elements of Kendall's ![]() matrix are 1:
matrix are 1:
Kendall's ![]() is related to SpearmanRho:
is related to SpearmanRho:
SpearmanRho tends to be about ![]()
![]() given weak linear association:
given weak linear association:
Use KendallTauTest to test for independence:
Alternatively, use IndependenceTest to automatically select an appropriate test:
Kendall's ![]() will attain 1 or -1 if the variables are perfectly monotonically related:
will attain 1 or -1 if the variables are perfectly monotonically related:
This is in contrast to Correlation, which strictly measures linear association:
Kendall's ![]() for a continuous bivariate distribution:
for a continuous bivariate distribution:
Kendall's ![]() for discrete distributions accounts for the distribution of ties:
for discrete distributions accounts for the distribution of ties:
Compare to a simulated value with and without corrections for ties:
Text
Wolfram Research (2012), KendallTau, Wolfram Language function, https://reference.wolfram.com/language/ref/KendallTau.html.
CMS
Wolfram Language. 2012. "KendallTau." Wolfram Language & System Documentation Center. Wolfram Research. https://reference.wolfram.com/language/ref/KendallTau.html.
APA
Wolfram Language. (2012). KendallTau. Wolfram Language & System Documentation Center. Retrieved from https://reference.wolfram.com/language/ref/KendallTau.html