LogLikelihood
LogLikelihood[dist,{x1,x2,…}]
gives the log‐likelihood function for observations x1, x2, … from the distribution dist.
LogLikelihood[proc,{{t1,x1},{t2,x2},…}]
gives the log-likelihood function for the observations xi at time ti from the process proc.
LogLikelihood[proc,{path1,path2,…}]
gives the log-likelihood function for the observations from path1, path2, … from the process proc.
Details
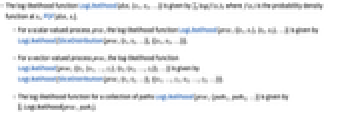
- The log‐likelihood function LogLikelihood[dist,{x1,x2,…}] is given by
 , where
  is the probability density function at xi, PDF[dist,xi].
 - For a scalar‐valued process proc, the log-likelihood function LogLikelihood[proc,{{t1,x1},{t2,x2},…}] is given by LogLikelihood[SliceDistribution[proc,{t1,t2,…}],{{x1,x2,…}}].
- For a vector‐valued process proc, the log-likelihood function LogLikelihood[proc,{{t1,{x1,…,z1},{t2,{x2,…,z2}},…}] is given by LogLikelihood[SliceDistribution[proc,{t1,t2,…}],{{x1,…,z1,x2,…,z2,…}}].
- The log-likelihood function for a collection of paths LogLikelihood[proc,{path1,path2,…}] is given by
 LogLikelihood[proc,pathi].
Examples
open allclose allBasic Examples (4)
Scope (12)
Univariate Parametric Distributions (2)
Multivariate Parametric Distributions (2)
Derived Distributions (5)
Compute the log‐likelihood for a truncated standard normal:
Plot the log‐likelihood contours as a function of the truncation points:
Compute the log‐likelihood for a constructed distribution:
Compute the log‐likelihood for a product distribution:
Obtain the result as a sum of the independent componentwise log‐likelihoods:
Compute the log‐likelihood for a copula distribution:
Plot the log‐likelihood as a function of the kernel parameter:
Random Processes (3)
Compute the log-likelihood of a continuous parametric process:
Compute the log-likelihood of a scalar-valued discrete parametric process:
Plot the log‐likelihood as a function of the process parameter:
Compute the log-likelihood of a scalar-valued time series process:
Compute the log-likelihood of a vector-valued time series process:
Applications (4)
Visualize the log‐likelihood surface for a distribution of two parameters:
Visualize as contours of equal log‐likelihood:
Show log-likelihood functions with mixed continuous and discrete parameters:
Solve for the Poisson maximum log-likelihood estimate in closed form:
Compute a maximum log-likelihood estimate directly:
Label the optimal point on a plot of the log-likelihood function:
Estimate the variance of the MLE estimator as the reciprocal of the expectation of second derivative of the log-likelihood function with respect to parameters:
Properties & Relations (5)
LogLikelihood is the sum of logs of PDF values for data:
LogLikelihood is the log of Likelihood:
EstimatedDistribution estimates parameters by maximizing the log‐likelihood:
FindDistributionParameters gives the parameter estimates as rules:
Visualize the log‐likelihood function near the optimal value:
Log-likelihood of a process can be computed using its slice distribution:
Vectorize the path values for use in the LogLikelihood of the time slice distribution:
Given a sample from a distribution , the difference between values of LogLikelihood for and the MLE estimated distribution doubled is random and follows ChiSquareDistribution with degrees of freedom equal to the number of distribution parameters:
Draw samples from a 5-parameter binormal distribution in 1000 batches:
Compute the difference of log-likelihoods for each batch:
Check that the log-likelihood differences are consistent with ![]() ‐distribution:
‐distribution:
Possible Issues (1)
Text
Wolfram Research (2010), LogLikelihood, Wolfram Language function, https://reference.wolfram.com/language/ref/LogLikelihood.html (updated 2014).
CMS
Wolfram Language. 2010. "LogLikelihood." Wolfram Language & System Documentation Center. Wolfram Research. Last Modified 2014. https://reference.wolfram.com/language/ref/LogLikelihood.html.
APA
Wolfram Language. (2010). LogLikelihood. Wolfram Language & System Documentation Center. Retrieved from https://reference.wolfram.com/language/ref/LogLikelihood.html