


FindDistributionParameters
FindDistributionParameters[data,dist]
finds the parameter estimates for the distribution dist from data.
FindDistributionParameters[data,dist,{{p,p0},{q,q0},…}]
finds the parameters p, q, … with starting values p0, q0, ….
Details and Options
- FindDistributionParameters returns a list of replacement rules for the parameters in dist.
- The data must be a list of possible outcomes from the given distribution dist.
- The distribution dist can be any parametric univariate, multivariate, or derived distribution with unknown parameters.
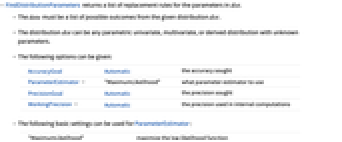
- The following options can be given:
-
AccuracyGoal Automatic the accuracy sought ParameterEstimator "MaximumLikelihood" what parameter estimator to use PrecisionGoal Automatic the precision sought WorkingPrecision Automatic the precision used in internal computations - The following basic settings can be used for ParameterEstimator:
-
"MaximumLikelihood" maximize the log‐likelihood function "MethodOfMoments" match raw moments "MethodOfCentralMoments" match central moments "MethodOfCumulants" match cumulants "MethodOfFactorialMoments" match factorial moments - The maximum likelihood method attempts to maximize the log-likelihood function
 , where
  are the distribution parameters and
  is the PDF of the distribution.
 - The method of moments solves
 ,
,  ,
,  where
where  is the
") sample moment and
sample moment and  is the
") moment of the distribution with parameters
moment of the distribution with parameters  .
. - Method-of-moment-based estimators may not satisfy all restrictions on parameters.
Examples
open all close allBasic Examples (3)
Scope (15)
Basic Uses (5)
Estimate both parameters for a binomial distribution:
Estimate p, assuming n is known:
Estimate n, assuming p is known:
Get the distribution with maximum likelihood parameter estimate for a particular family:
Check goodness of fit by comparing a histogram of the data and the estimate's PDF:
Perform goodness-of-fit tests with null distribution from res:
Perform tests correcting for estimation of the parameter:
Estimate parameters by maximizing the log‐likelihood:
Plot the log‐likelihood function to visually check that the solution is optimal:
Visualize a log‐likelihood surface to find rough values for the parameters:
Supply those rough values as starting values for the estimation:
Mark the optimal point on the contour plot:
Univariate Parametric Distributions (2)
Multivariate Parametric Distributions (2)
Derived Distributions (6)
Estimate parameters for a truncated normal:
Estimate parameters for a constructed distribution:
Estimate parameters for a product distribution:
Estimate parameters for a copula distribution:
Estimate parameters for a component mixture:
Estimate the mixture probabilities assuming the component distributions are known:
Options (4)
ParameterEstimator (3)
Estimate parameters by matching cumulants:
Other moment‐based methods typically give similar results:
Estimate parameters based on default moments:
Estimate parameters from the first and fourth moments:
Obtain the maximum likelihood estimates using the default method:
Use FindMaximum to obtain the estimates:
Use EvaluationMonitor to extract the points sampled:
Applications (17)
Use One Parameter Estimator to Get Starting Values for Another (1)
Obtain Starting Values for Another Estimation (1)
Estimate Laplace parameters for data from an ExponentialPowerDistribution:
Use the Laplace estimate as a starting point for estimating exponential power parameters:
Compare the data with the Laplace and exponential power estimates:
Parameter Estimation of Similarly Shaped Distributions (1)
Accident Claims (1)
Word Lengths in Different Languages (1)
Get word length data for several languages:
Model the word lengths for each language as binomially distributed with ![]() :
:
Compare the actual and estimated distributions:
Bootstrap the distribution of p values based on these 9 results:
Estimate the expected value of p and a standard deviation for the estimate:
Text Frequency (1)
The word count in a text follows a Zipf distribution:
Fit a ZipfDistribution to the word frequency data:
Fit a truncated ZipfDistribution to counts at most 50 using rhohat as a starting value:
Visualize the CDFs up to the truncation value:
Estimate the proportion of the original data not included in the truncated model:
Earthquake Magnitudes (1)
Find estimates for a multimodal MixtureDistribution model:
The magnitudes of earthquakes in the United States in the selected years have two modes:
Fit distribution from possible mixtures of one NormalDistribution with another:
Extract the means of the components:
The components' means are far enough apart that they are still the modes:
Wind Speed Analysis (1)
Model monthly maximum wind speeds in Boston:
Fit the data to a RayleighDistribution:
Compare the empirical and fitted quantiles to see where the models deviate from the data:
Distribution of Incomes (1)
Market Change in Stock Values (1)
Use a beta distribution to model the proportion of Dow Jones Industrial stocks that increase in value on a given day:
Find daily change for Dow Jones Industrial stocks:
Number of days for each financial entity:
Extract values from time series for each entity and normalize numeric quantities:
Check if each entity has the same length of data:
Calculate the daily ratio of companies with an increase in value:
Find parameter estimates, excluding days with zero or all companies having an increase in value:
Visualize the likelihood contours and mark the optimal point:
Automobile Fuel Efficiency (1)
The average city and highway mileage for midsize cars follows a binormal distribution:
Assume city and highway miles per gallon are normally distributed and correlated:
Extract the estimated average city and highway mileages:
Extract the estimated correlation between city and highway mileages:
Visualize the joint density on a logarithmic scale with the mean mileage marked with a blue point:
Earthquake Waiting Times (1)
The data contains waiting times in days between serious (magnitude at least 7.5 or over 1000 fatalities) earthquakes worldwide, recorded from 12/16/1902 to 3/4/1977:
Model waiting times by an ExponentialDistribution:
Estimate the average and median number of days between major earthquakes:
Earthquake Frequency (1)
The number of earthquakes per year can be modeled by SinghMaddalaDistribution:
Fit the distribution to the data:
Compute the maximized log‐likelihood:
Visualize the log‐likelihood profiles near the optimal parameter values:
Time between Geyser Eruptions (1)
Stock Price Distribution (1)
Water Flow Rates (1)
Consider the annual minimum daily flows given in cubic meters per second for the Mahanadi river:
Model the annual minimum mean daily flows as a MinStableDistribution:
Simulate annual minimum mean daily flows for the next 30 years:
Properties & Relations (8)
FindDistributionParameters gives estimates as replacement rules:
EstimatedDistribution gives a distribution with parameter estimates inserted:
FindProcessParameters returns a list of parameter estimates for a random process:
FindDistributionParameters returns a list of parameter estimates for a distribution:
Estimate distribution parameters by maximum likelihood:
Use DistributionFitTest to test quality of the fit:
Extract the fitted distribution parameter:
Obtain a table of relevant test statistics and p‐values:
Estimate parameters in a parametric distribution:
Get a nonparametric kernel density estimate using SmoothKernelDistribution:
Compare the PDFs for the nonparametric and parametric distributions:
Visualize the nonparametric density using SmoothHistogram:
Get a maximum likelihood estimate of parameters:
Compute the likelihood using Likelihood:
Compute the log‐likelihood using LogLikelihood:
Estimate parameters by matching raw moments:
Compute raw moments from the data using Moment:
Compute the same moments from the beta distribution for the estimated parameters:
Estimate parameters for a Weibull distribution:
Use QuantilePlot to visualize the empirical quantiles versus the theoretical quantiles:
Obtain the same visualization when the estimation is done within QuantilePlot:
FindDistributionParameters ignores time stamps in TimeSeries and EventSeries:
For TemporalData, all the path structure is ignored:
Text
Wolfram Research (2010), FindDistributionParameters, Wolfram Language function, https://reference.wolfram.com/language/ref/FindDistributionParameters.html.
CMS
Wolfram Language. 2010. "FindDistributionParameters." Wolfram Language & System Documentation Center. Wolfram Research. https://reference.wolfram.com/language/ref/FindDistributionParameters.html.
APA
Wolfram Language. (2010). FindDistributionParameters. Wolfram Language & System Documentation Center. Retrieved from https://reference.wolfram.com/language/ref/FindDistributionParameters.html