MatrixTDistribution[Σrow,Σcol,ν]
represents zero mean matrix ![]() distribution with row covariance matrix Σrow, column covariance matrix Σcol, and degrees of freedom parameter ν.
distribution with row covariance matrix Σrow, column covariance matrix Σcol, and degrees of freedom parameter ν.
MatrixTDistribution[μ,Σrow,Σcol,ν]
represents matrix ![]() distribution with mean matrix μ.
distribution with mean matrix μ.


MatrixTDistribution
MatrixTDistribution[Σrow,Σcol,ν]
represents zero mean matrix ![]() distribution with row covariance matrix Σrow, column covariance matrix Σcol, and degrees of freedom parameter ν.
distribution with row covariance matrix Σrow, column covariance matrix Σcol, and degrees of freedom parameter ν.
MatrixTDistribution[μ,Σrow,Σcol,ν]
represents matrix ![]() distribution with mean matrix μ.
distribution with mean matrix μ.
Details
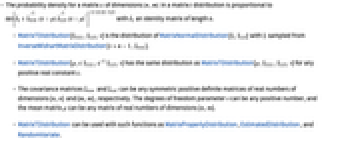
- The probability density for a matrix
 of dimensions
  in a matrix
  distribution is proportional to
  with
with  an identity matrix of length
  .
. - MatrixTDistribution[Σrow,Σcol,ν] is the distribution of MatrixNormalDistribution[Σ,Σcol] with
 sampled from InverseWishartMatrixDistribution[ν+n-1,Σrow].
 - MatrixTDistribution[μ,c Σrow,c-1 Σcol,ν] has the same distribution as MatrixTDistribution[μ,Σrow,Σcol,ν] for any positive real constant c.
- The covariance matrices Σrow and Σcol can be any symmetric positive definite matrices of real numbers of dimensions {n,n} and {m,m}, respectively. The degrees of freedom parameter ν can be any positive number, and the mean matrix μ can be any matrix of real numbers of dimensions {n,m}.
- MatrixTDistribution can be used with such functions as MatrixPropertyDistribution, EstimatedDistribution, and RandomVariate.
Examples
open all close allScope (6)
Generate a single pseudorandom matrix:
Generate a single pseudorandom matrix with nonzero mean:
Generate a set of pseudorandom matrices:
Distribution parameters estimation:
Estimate the distribution parameters from sample data:
Compare LogLikelihood for both distributions:
Properties & Relations (4)
Matrix t distribution is defined up to a positive multiplicative constant:
Equivalent distribution with row and column scale matrices multiplied and divided by a positive constant:
Compute the PDF of the distributions at a random point:
MatrixTDistribution[Σrow,Σcol,ν] is a parameter mixture of MatrixNormalDistribution[Σ,Σcol] with ![]() following InverseWishartMatrixDistribution[ν+n-1,Σrow]:
following InverseWishartMatrixDistribution[ν+n-1,Σrow]:
Create a sample following the parameter mixture of MatrixNormalDistribution with InverseWishartMatrixDistribution:
Fit the sample data to MatrixTDistribution:
Compute log-likelihood ratio statistic against the appropriate MatrixTDistribution
Log-likelihood ratio follows ChiSquareDistribution with the parameter equal to the number of degrees of freedom:
Compute the ![]() -value of log-likelihood ratio test:
-value of log-likelihood ratio test:
For matrix ![]() sampled from matrix
sampled from matrix ![]() distribution, the expression
distribution, the expression ![]() follows Student
follows Student ![]() distribution for any nonzero vectors
distribution for any nonzero vectors ![]() and
and ![]() with lengths that match with the dimension of
with lengths that match with the dimension of ![]() :
:
Use MatrixPropertyDistribution to sample values of the expression ![]() :
:
Check agreement with the expected ![]() distribution:
distribution:
For matrix ![]() sampled from matrix
sampled from matrix ![]() distribution,
distribution, ![]() follows multivariate
follows multivariate ![]() distribution for any nonzero vector
distribution for any nonzero vector ![]() with length that matches with the number of columns of
with length that matches with the number of columns of ![]() :
:
Use MatrixPropertyDistribution to sample values of ![]() :
:
Possible Issues (1)
Matrix ![]() distribution is defined up to a multiplicative scaling constant. The estimated parameters may not be close to the ones that specify the underlying distribution:
distribution is defined up to a multiplicative scaling constant. The estimated parameters may not be close to the ones that specify the underlying distribution:
Sample from the matrix ![]() distribution:
distribution:
Compare the estimated scale parameters with the ones of the underlying distribution:
Kronecker products of the scale matrices are close to each other:
The LogLikelihood of the distributions indicate that the estimate is good:
Text
Wolfram Research (2015), MatrixTDistribution, Wolfram Language function, https://reference.wolfram.com/language/ref/MatrixTDistribution.html (updated 2017).
CMS
Wolfram Language. 2015. "MatrixTDistribution." Wolfram Language & System Documentation Center. Wolfram Research. Last Modified 2017. https://reference.wolfram.com/language/ref/MatrixTDistribution.html.
APA
Wolfram Language. (2015). MatrixTDistribution. Wolfram Language & System Documentation Center. Retrieved from https://reference.wolfram.com/language/ref/MatrixTDistribution.html